


Global Bioprocess Containers Market Overview
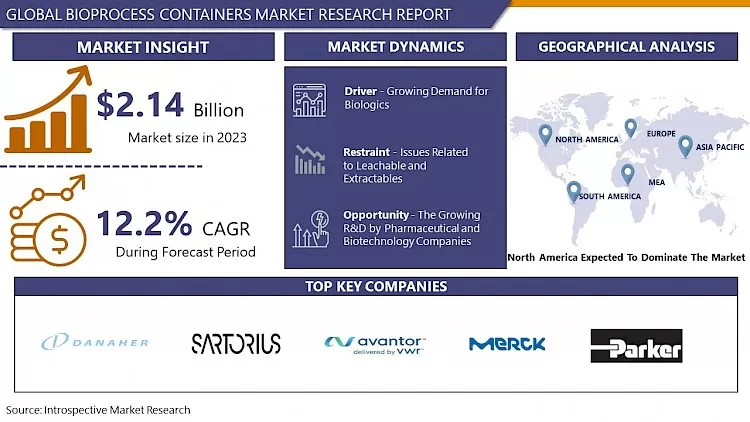
The Global Bioprocess Containers market was valued at USD 2.14 billion in 2023 and is expected to reach USD 4.18 billion by the year 2032, at a CAGR of 12.2%.
Thermo Scientific Bioprocess Containers (BPCs) and transfer assemblies are ready-to-use single-use flexible container systems for critical liquid handling utilization in biopharmaceutical and biomanufacturing operations. Applications for bioprocess containers have raised adequately over the past few years as the demand for single-use solutions for pharmaceutical and bioprocessing production has increased. For example, Saint Gobain has an extensive range of bioprocess bag solutions ranging from small 25ml cell culture bags, right up to 3000L bags for larger volume applications. Furthermore, key factors imputing to the growth of the market are the increase in the global prevalence of cancer and immunological disorder cases that necessitate the need for vaccines and biologics associated with the raised preference for Immunotherapy to the Chemotherapy accelerate the demand for the bioprocess containers.
For instance, as per the American Cancer Society report, in 2019, about 1,762,450 new cancer cases were identified and 606,880 cancer deaths registered in the United States demanding treatment with novel and efficient methods. In addition, an increase in the approval of new drugs by the FDA and the introduction of new products in the forecast period and is expected to offer profitable opportunities that accelerate market growth worldwide. Moreover, the advancements in single-use bioprocess technologies increased the inexpensive and sustainability of vaccine production along with a reduction in the risk of cross-contamination is anticipated to stimulate the market over the projected period.

COVID-19 Impact on Global Bioprocess Containers Market
COVID-19 pandemic adversely affected almost all over sectors globally. The novel coronavirus outbreak began in Wuhan (China) in December 2019, COVID-19 has since shifted from being a regional crisis to a global pandemic. As the World Health Organization (WHO) officially announced the outbreak of the virus as a pandemic, a mix of established pharmaceutical companies, as well as players in the bioprocess containers market, have moved forward to produce treatments and vaccines that focus on the infection caused by the novel coronavirus. As long as most of the top COVID-19 vaccine programs are utilizing novel applications, comprising mRNA, DNA vaccine, and vectors, these platforms are majorly built on single-use technology. Most of the COVID-19 related latest units are largely captivating single-use systems owing to their flexibility combined with high speed and much lower capital investment compared to traditional stainless-steel equipment. Hence, the rising adoption of single-use technologies for COVID-19 pandemic-related research, coupled with growing vaccine development by key players, is anticipated to have a positive impact on the global bioprocess containers market.
Market Dynamics and Forecast for the Global Bioprocess Containers Market
Drivers:
Growth in demand for biologics drives the global bioprocess containers market. New biologics are being expanded for the treatment of diabetes, cancer, and other serious medical conditions. Investment by biopharmaceutical companies and an increase in the incidence of chronic diseases are the factors fueling the growth of biologics. Bioprocess container components are readily integrated into different high-performance systems for all steps in the production of biologics. Therefore, an increase in demand for biologics stimulates market growth.
Vaccine manufacturing using single-use disposable technologies is another factor that turns the market in terms of revenue. Single-use technology (SUT) products are extensively accepted for the production of vaccines and also for biologics, due to demonstrated performance and cost- and timesaving significance. Single-use technology devices provide importance such as fewer cleaning and sterilization processes, declined cross-contamination risks, and shorter setup times. An increase in the requirement of vaccine production using single-use technology (SUT) products trigger the growth of the market.
The growth of single-use technologies can be attributed to the rising requirement for better, cheaper, and faster biologics production. Active development of individualized biologics and personalized medicines, comprising patient-specific cellular & gene therapies and therapeutic vaccines, demands high sterility and is therefore produced using single-use equipment and consumables. The COVID-19 pandemic caused the extraordinary demand for vaccines. The pandemic, in turn, has increased the application of large-scale and laboratory-scale single-use bioreactors and associated consumables such as media bags, bioprocess containers, filtration assemblies, and other consumables.
Restraints:
Massive problems related to leachable and extractable bioprocess containers, implementation of strict regulatory policies toward production practice of bioprocess containers, and high cost of instruments pose a major restraint for the growth of the market. Compared to traditional bio-manufacturing technologies, single-use systems (SUS) have many advantages, such as declined deeds for process validation and higher manufacturing flexibility, which eventually results in higher operating efficiency and decreased manufacturing costs. Despite this importance, there is a possibility that the plastic materials used for SUS may leach organic compounds or inorganic substances into the processing fluid or the final drug product, which remains a key concern. Such an undesired change could eventually compromise bioprocessing and might adversely impact the quality, safety, and purity of the drug product.
Opportunities:
The patent expiry of blockbuster drugs has followed in raised R&D spending by pharmaceutical and biotechnology companies. Patent expiry of biologics leads to rising R&D of biologics and change biologics from the pipeline to commercial production. As the development and production costs of biologics are very high, companies are now moderately targeting techniques that are more economical than traditional biomanufacturing methods. Consequently, different biopharmaceutical manufacturers are including single-use bioprocessing technologies in their development processes. By using single-use bioprocessing assemblies such as bioprocess containers, biomanufacturing companies can develop inventive products at inexpensive budgets that fulfill customer requirements and demands. Moreover, in combination with continuous DSP and disposable technologies, it creates the opportunity for small-scale production processes of low investments costs and risks. Additionally, the creation of high-volume cell banks could also be attained resulting in a diminished bioreactor train in manufacturing processes.
Market Segmentation
Segmentation Analysis of Global Bioprocess Containers Market:
Based on Type, the 2D bioprocess containers segment is expected to register the maximum market share of the global bioprocess containers market during the forecast period. 2D bioprocess containers are often used in cell harvesting and for the transportation of bulk drug products and bulk drug precursors.
Based on Application, the upstream processes segment is expected to dominate the global bioprocess containers market during the forecast period. The upstream processes segment is anticipated to grow at the highest CAGR during the forecasted period. The upstream process is accounted for in the first stage of the bioprocess, from cell line development and cultivation to culture extension of the cells through harvest. Growth in the number of cell researches improves the augment in the upstream processes segment. Upstream processes make the highest usage of bioprocess containers, primarily during fermentation and culture media processing; owing to this, this segment holds the maximum market share.
Based on End-Users, the pharmaceutical & biopharmaceutical companies segment is expected to register the largest market share of the global bioprocess containers market. The demand for biopharmaceuticals among the senior population is growing as the elderly are more prone to various diseases/disorders that can be treated using biologics. This has followed in the rising attention of biopharmaceutical companies emerging affordable biologics at lower costs. As bioprocess containers have extensive applications in research & process advancement, the adoption of BPCs is increasing with the growth in the development and production of biologics and biosimilars.
Regional Analysis of Global Bioprocess Containers Market:
North America is anticipated to dominate the overall bioprocess container market over the projected period. This dominance is mainly due to the strong demand for biopharmaceuticals owing to the increase in the geriatric population and advanced health care infrastructure in the United States. In addition, owing to the presence of leading players targeting research activities and massive investments in health care by manufacturers based in the United States contributes to its magnificent market growth globally.
North America followed by Europe holds the second-highest market globally with an increase in the life science R&D companies and manufacturing units of biologics and biosimilars in the region. Thus, the requirement of bioprocess containers raised significantly to overcome the process complications and contamination risks primarily contribute to the growth of the market in the region accelerating the global market.
The Asia Pacific market is expected to observe the maximum market share during the projected period due to the significant investments by key market players coupled with the rising government support in the region. The latest developments in countries such as India, China, and Japan with a high R&D infrastructure of pharmaceutical manufacturing and comparatively cheaper labor costs accelerate the market revenue. For example, in May 2017, Merck began its first joint bioprocess Scale-Up laboratory in Bengaluru, India with Stelis Biopharma to offer end-to-end solutions for pre-clinical, clinical, and commercial supply indicating massive development for the market in the region.
Players Covered in Bioprocess Containers Market are:
- Thermo Fisher Scientific
- Danaher Corporation
- Sartorius Stedim Biotech
- Rim Bio
- Finesse Solutions
- Optimum Processing Inc.
- Merck Millipore
- PARKER HANNIFIN CORP
- Lonza Group AG
- Avantor Inc.
- General Electric Company
- Saint- Gobain S.A.
- GE Healthcare
- GE Healthcare
- Meissner
- Fluids Control
- Neta Scientific Incorporated Inc.
- ALLpaQ Packaging Group
- Others major Players.
Key Industry Developments in Global Bioprocess Containers Market
- IIn July 2024, Duoning Biotechnology Group ("Duoning"), a leading one-stop bioprocess solution provider, announced it has attended at Interphex Korea 2024 to showcase its total bioprocess solutions for the preparation of diverse biological products. Interphex 2024 provides an opportunity for a wide range of life science industry leaders to explore the optimal process for developing biological products.
|
Global Bioprocess Containers Market |
|||
|
Base Year: |
2023 |
Forecast Period: |
2024-2032 |
|
Historical Data: |
2017 to 2023 |
Market Size in 2023: |
USD 12.14 Bn. |
|
Forecast Period 2023-32 CAGR: |
12.2% |
Market Size in 2032: |
USD 4.18 Bn. |
|
Segments Covered: |
By Type |
|
|
|
By Application |
|
||
|
By End Users |
|
||
|
By Region |
|
||
|
Key Market Drivers: |
|
||
|
Key Market Restraints: |
|
||
|
Key Opportunities: |
|
||
|
Companies Covered in the report: |
|
||
1.1 Scope and Coverage
Chapter 2:Executive Summary
Chapter 3: Market Landscape
3.1 Market Dynamics
3.1.1 Drivers
3.1.2 Restraints
3.1.3 Opportunities
3.1.4 Challenges
3.2 Market Trend Analysis
3.3 PESTLE Analysis
3.4 Porter's Five Forces Analysis
3.5 Industry Value Chain Analysis
3.6 Ecosystem
3.7 Regulatory Landscape
3.8 Price Trend Analysis
3.9 Patent Analysis
3.10 Technology Evolution
3.11 Investment Pockets
3.12 Import-Export Analysis
Chapter 4: Bioprocess Containers Market by Type (2018-2032)
4.1 Bioprocess Containers Market Snapshot and Growth Engine
4.2 Market Overview
4.3 2D Bioprocess Containers
4.3.1 Introduction and Market Overview
4.3.2 Historic and Forecasted Market Size in Value USD and Volume Units
4.3.3 Key Market Trends, Growth Factors, and Opportunities
4.3.4 Geographic Segmentation Analysis
4.4 3D Bioprocess Containers
4.5 Tank Liners
4.6 Others
Chapter 5: Bioprocess Containers Market by Application (2018-2032)
5.1 Bioprocess Containers Market Snapshot and Growth Engine
5.2 Market Overview
5.3 Process Development
5.3.1 Introduction and Market Overview
5.3.2 Historic and Forecasted Market Size in Value USD and Volume Units
5.3.3 Key Market Trends, Growth Factors, and Opportunities
5.3.4 Geographic Segmentation Analysis
5.4 Upstream
5.5 Downstream
Chapter 6: Bioprocess Containers Market by End Users (2018-2032)
6.1 Bioprocess Containers Market Snapshot and Growth Engine
6.2 Market Overview
6.3 Pharmaceutical Companies
6.3.1 Introduction and Market Overview
6.3.2 Historic and Forecasted Market Size in Value USD and Volume Units
6.3.3 Key Market Trends, Growth Factors, and Opportunities
6.3.4 Geographic Segmentation Analysis
6.4 Biopharmaceutical Companies
6.5 CMOS & CROS
6.6 Academic & Research Institute
6.7 Others
Chapter 7: Company Profiles and Competitive Analysis
7.1 Competitive Landscape
7.1.1 Competitive Benchmarking
7.1.2 Bioprocess Containers Market Share by Manufacturer (2024)
7.1.3 Industry BCG Matrix
7.1.4 Heat Map Analysis
7.1.5 Mergers and Acquisitions
7.2 BRABENDER GMBH & CO. KG (GERMANY)
7.2.1 Company Overview
7.2.2 Key Executives
7.2.3 Company Snapshot
7.2.4 Role of the Company in the Market
7.2.5 Sustainability and Social Responsibility
7.2.6 Operating Business Segments
7.2.7 Product Portfolio
7.2.8 Business Performance
7.2.9 Key Strategic Moves and Recent Developments
7.2.10 SWOT Analysis
7.3 MONDELEZ INTERNATIONAL AND UNIVERSAL ROBINA. (US)
7.4 BÜHLER (SWITZERLAND)
7.5 AKRON TOOL & DIE (US)
7.6 JINAN DARIN MACHINERY COGROUPE LEGRIS INDUSTRIES (BELGIUM)
7.7 LINDQUIST MACHINE CORPORATION (USA)
7.8 BAKER PERKINS (UK)
7.9 COPERION (GERMANY)
7.10 GEA (GERMANY)
7.11 KAHL GROUP (GERMANY)
7.12 TRIOTT GROUP (NETHERLANDS)
7.13 FLEXICON (US)
7.14 KAHL GROUP (GERMANY)
7.15 THE BONNOT COMPANY (US)
7.16 PAVAN SPA(ITALY)
7.17 AMERICAN EXTRUSION INTERNATIONAL (US)
7.18 SHANDONG LIGHT M&E CO.LTD (CHINA)
7.19 SNACTEK (INDIA)
7.20 DOERING SYSTEMS INC. (US)
7.21 PACMOORE (US)
7.22 EGAN FOOD TECHNOLOGIES (US)
7.23 SCHAAF TECHNOLOGIE GMBH (GERMANY)
7.24 WENGER MANUFACTURING INC. (US)AND OTHERS MAJOR KEY PLAYERS.
Chapter 8: Global Bioprocess Containers Market By Region
8.1 Overview
8.2. North America Bioprocess Containers Market
8.2.1 Key Market Trends, Growth Factors and Opportunities
8.2.2 Top Key Companies
8.2.3 Historic and Forecasted Market Size by Segments
8.2.4 Historic and Forecasted Market Size by Type
8.2.4.1 2D Bioprocess Containers
8.2.4.2 3D Bioprocess Containers
8.2.4.3 Tank Liners
8.2.4.4 Others
8.2.5 Historic and Forecasted Market Size by Application
8.2.5.1 Process Development
8.2.5.2 Upstream
8.2.5.3 Downstream
8.2.6 Historic and Forecasted Market Size by End Users
8.2.6.1 Pharmaceutical Companies
8.2.6.2 Biopharmaceutical Companies
8.2.6.3 CMOS & CROS
8.2.6.4 Academic & Research Institute
8.2.6.5 Others
8.2.7 Historic and Forecast Market Size by Country
8.2.7.1 US
8.2.7.2 Canada
8.2.7.3 Mexico
8.3. Eastern Europe Bioprocess Containers Market
8.3.1 Key Market Trends, Growth Factors and Opportunities
8.3.2 Top Key Companies
8.3.3 Historic and Forecasted Market Size by Segments
8.3.4 Historic and Forecasted Market Size by Type
8.3.4.1 2D Bioprocess Containers
8.3.4.2 3D Bioprocess Containers
8.3.4.3 Tank Liners
8.3.4.4 Others
8.3.5 Historic and Forecasted Market Size by Application
8.3.5.1 Process Development
8.3.5.2 Upstream
8.3.5.3 Downstream
8.3.6 Historic and Forecasted Market Size by End Users
8.3.6.1 Pharmaceutical Companies
8.3.6.2 Biopharmaceutical Companies
8.3.6.3 CMOS & CROS
8.3.6.4 Academic & Research Institute
8.3.6.5 Others
8.3.7 Historic and Forecast Market Size by Country
8.3.7.1 Russia
8.3.7.2 Bulgaria
8.3.7.3 The Czech Republic
8.3.7.4 Hungary
8.3.7.5 Poland
8.3.7.6 Romania
8.3.7.7 Rest of Eastern Europe
8.4. Western Europe Bioprocess Containers Market
8.4.1 Key Market Trends, Growth Factors and Opportunities
8.4.2 Top Key Companies
8.4.3 Historic and Forecasted Market Size by Segments
8.4.4 Historic and Forecasted Market Size by Type
8.4.4.1 2D Bioprocess Containers
8.4.4.2 3D Bioprocess Containers
8.4.4.3 Tank Liners
8.4.4.4 Others
8.4.5 Historic and Forecasted Market Size by Application
8.4.5.1 Process Development
8.4.5.2 Upstream
8.4.5.3 Downstream
8.4.6 Historic and Forecasted Market Size by End Users
8.4.6.1 Pharmaceutical Companies
8.4.6.2 Biopharmaceutical Companies
8.4.6.3 CMOS & CROS
8.4.6.4 Academic & Research Institute
8.4.6.5 Others
8.4.7 Historic and Forecast Market Size by Country
8.4.7.1 Germany
8.4.7.2 UK
8.4.7.3 France
8.4.7.4 The Netherlands
8.4.7.5 Italy
8.4.7.6 Spain
8.4.7.7 Rest of Western Europe
8.5. Asia Pacific Bioprocess Containers Market
8.5.1 Key Market Trends, Growth Factors and Opportunities
8.5.2 Top Key Companies
8.5.3 Historic and Forecasted Market Size by Segments
8.5.4 Historic and Forecasted Market Size by Type
8.5.4.1 2D Bioprocess Containers
8.5.4.2 3D Bioprocess Containers
8.5.4.3 Tank Liners
8.5.4.4 Others
8.5.5 Historic and Forecasted Market Size by Application
8.5.5.1 Process Development
8.5.5.2 Upstream
8.5.5.3 Downstream
8.5.6 Historic and Forecasted Market Size by End Users
8.5.6.1 Pharmaceutical Companies
8.5.6.2 Biopharmaceutical Companies
8.5.6.3 CMOS & CROS
8.5.6.4 Academic & Research Institute
8.5.6.5 Others
8.5.7 Historic and Forecast Market Size by Country
8.5.7.1 China
8.5.7.2 India
8.5.7.3 Japan
8.5.7.4 South Korea
8.5.7.5 Malaysia
8.5.7.6 Thailand
8.5.7.7 Vietnam
8.5.7.8 The Philippines
8.5.7.9 Australia
8.5.7.10 New Zealand
8.5.7.11 Rest of APAC
8.6. Middle East & Africa Bioprocess Containers Market
8.6.1 Key Market Trends, Growth Factors and Opportunities
8.6.2 Top Key Companies
8.6.3 Historic and Forecasted Market Size by Segments
8.6.4 Historic and Forecasted Market Size by Type
8.6.4.1 2D Bioprocess Containers
8.6.4.2 3D Bioprocess Containers
8.6.4.3 Tank Liners
8.6.4.4 Others
8.6.5 Historic and Forecasted Market Size by Application
8.6.5.1 Process Development
8.6.5.2 Upstream
8.6.5.3 Downstream
8.6.6 Historic and Forecasted Market Size by End Users
8.6.6.1 Pharmaceutical Companies
8.6.6.2 Biopharmaceutical Companies
8.6.6.3 CMOS & CROS
8.6.6.4 Academic & Research Institute
8.6.6.5 Others
8.6.7 Historic and Forecast Market Size by Country
8.6.7.1 Turkiye
8.6.7.2 Bahrain
8.6.7.3 Kuwait
8.6.7.4 Saudi Arabia
8.6.7.5 Qatar
8.6.7.6 UAE
8.6.7.7 Israel
8.6.7.8 South Africa
8.7. South America Bioprocess Containers Market
8.7.1 Key Market Trends, Growth Factors and Opportunities
8.7.2 Top Key Companies
8.7.3 Historic and Forecasted Market Size by Segments
8.7.4 Historic and Forecasted Market Size by Type
8.7.4.1 2D Bioprocess Containers
8.7.4.2 3D Bioprocess Containers
8.7.4.3 Tank Liners
8.7.4.4 Others
8.7.5 Historic and Forecasted Market Size by Application
8.7.5.1 Process Development
8.7.5.2 Upstream
8.7.5.3 Downstream
8.7.6 Historic and Forecasted Market Size by End Users
8.7.6.1 Pharmaceutical Companies
8.7.6.2 Biopharmaceutical Companies
8.7.6.3 CMOS & CROS
8.7.6.4 Academic & Research Institute
8.7.6.5 Others
8.7.7 Historic and Forecast Market Size by Country
8.7.7.1 Brazil
8.7.7.2 Argentina
8.7.7.3 Rest of SA
Chapter 9 Analyst Viewpoint and Conclusion
9.1 Recommendations and Concluding Analysis
9.2 Potential Market Strategies
Chapter 10 Research Methodology
10.1 Research Process
10.2 Primary Research
10.3 Secondary Research
|
Global Bioprocess Containers Market |
|||
|
Base Year: |
2023 |
Forecast Period: |
2024-2032 |
|
Historical Data: |
2017 to 2023 |
Market Size in 2023: |
USD 12.14 Bn. |
|
Forecast Period 2023-32 CAGR: |
12.2% |
Market Size in 2032: |
USD 4.18 Bn. |
|
Segments Covered: |
By Type |
|
|
|
By Application |
|
||
|
By End Users |
|
||
|
By Region |
|
||
|
Key Market Drivers: |
|
||
|
Key Market Restraints: |
|
||
|
Key Opportunities: |
|
||
|
Companies Covered in the report: |
|
||
Frequently Asked Questions :
The forecast period in the Bioprocess Containers Market research report is 2024-2032.
Sartorius Stedim Biotech (France), Thermo Fisher Scientific (US), Danaher Corporation (US), Merck Millipore (Germany), PARKER HANNIFIN CORP, Lonza Group AG, Avantor Inc., General Electric Company, Saint-Gobain S.A., GE Healthcare, Meissner, Fluids Control, Neta Scientific Incorporated Inc., ALLpaQ Packaging Group, and other major players.
The Bioprocess Containers Market is segmented into Type, Application, End Users, and region. By Type, the market is categorized into 2D Bioprocess Containers, 3D Bioprocess Containers, Tank Liners, and Others. By Application, the market is categorized into Process Development, Upstream, and Downstream. By End-User the market is categorized into Pharmaceutical Companies, Biopharmaceutical Companies, CMOS & CROS, Academic & Research Institute, and Others. By region, it is analyzed across North America (U.S.; Canada; Mexico), Europe (Germany; U.K.; France; Italy; Russia; Spain, etc.), Asia-Pacific (China; India; Japan; Southeast Asia, etc.), South America (Brazil; Argentina, etc.), Middle East & Africa (Saudi Arabia; South Africa, etc.).
Thermo Scientific Bioprocess Containers (BPCs) and transfer assemblies are ready-to-use single-use flexible container systems for critical liquid handling utilization in biopharmaceutical and biomanufacturing operations. Applications for bioprocess containers have raised adequately over the past few years as the demand for single-use Type for pharmaceutical and bioprocessing production has increased.
The Global Bioprocess Containers market was valued at USD 2.14 billion in 2023 and is expected to reach USD 4.18 billion by the year 2032, at a CAGR of 12.2%.


