


Bioenergy Market Synopsis
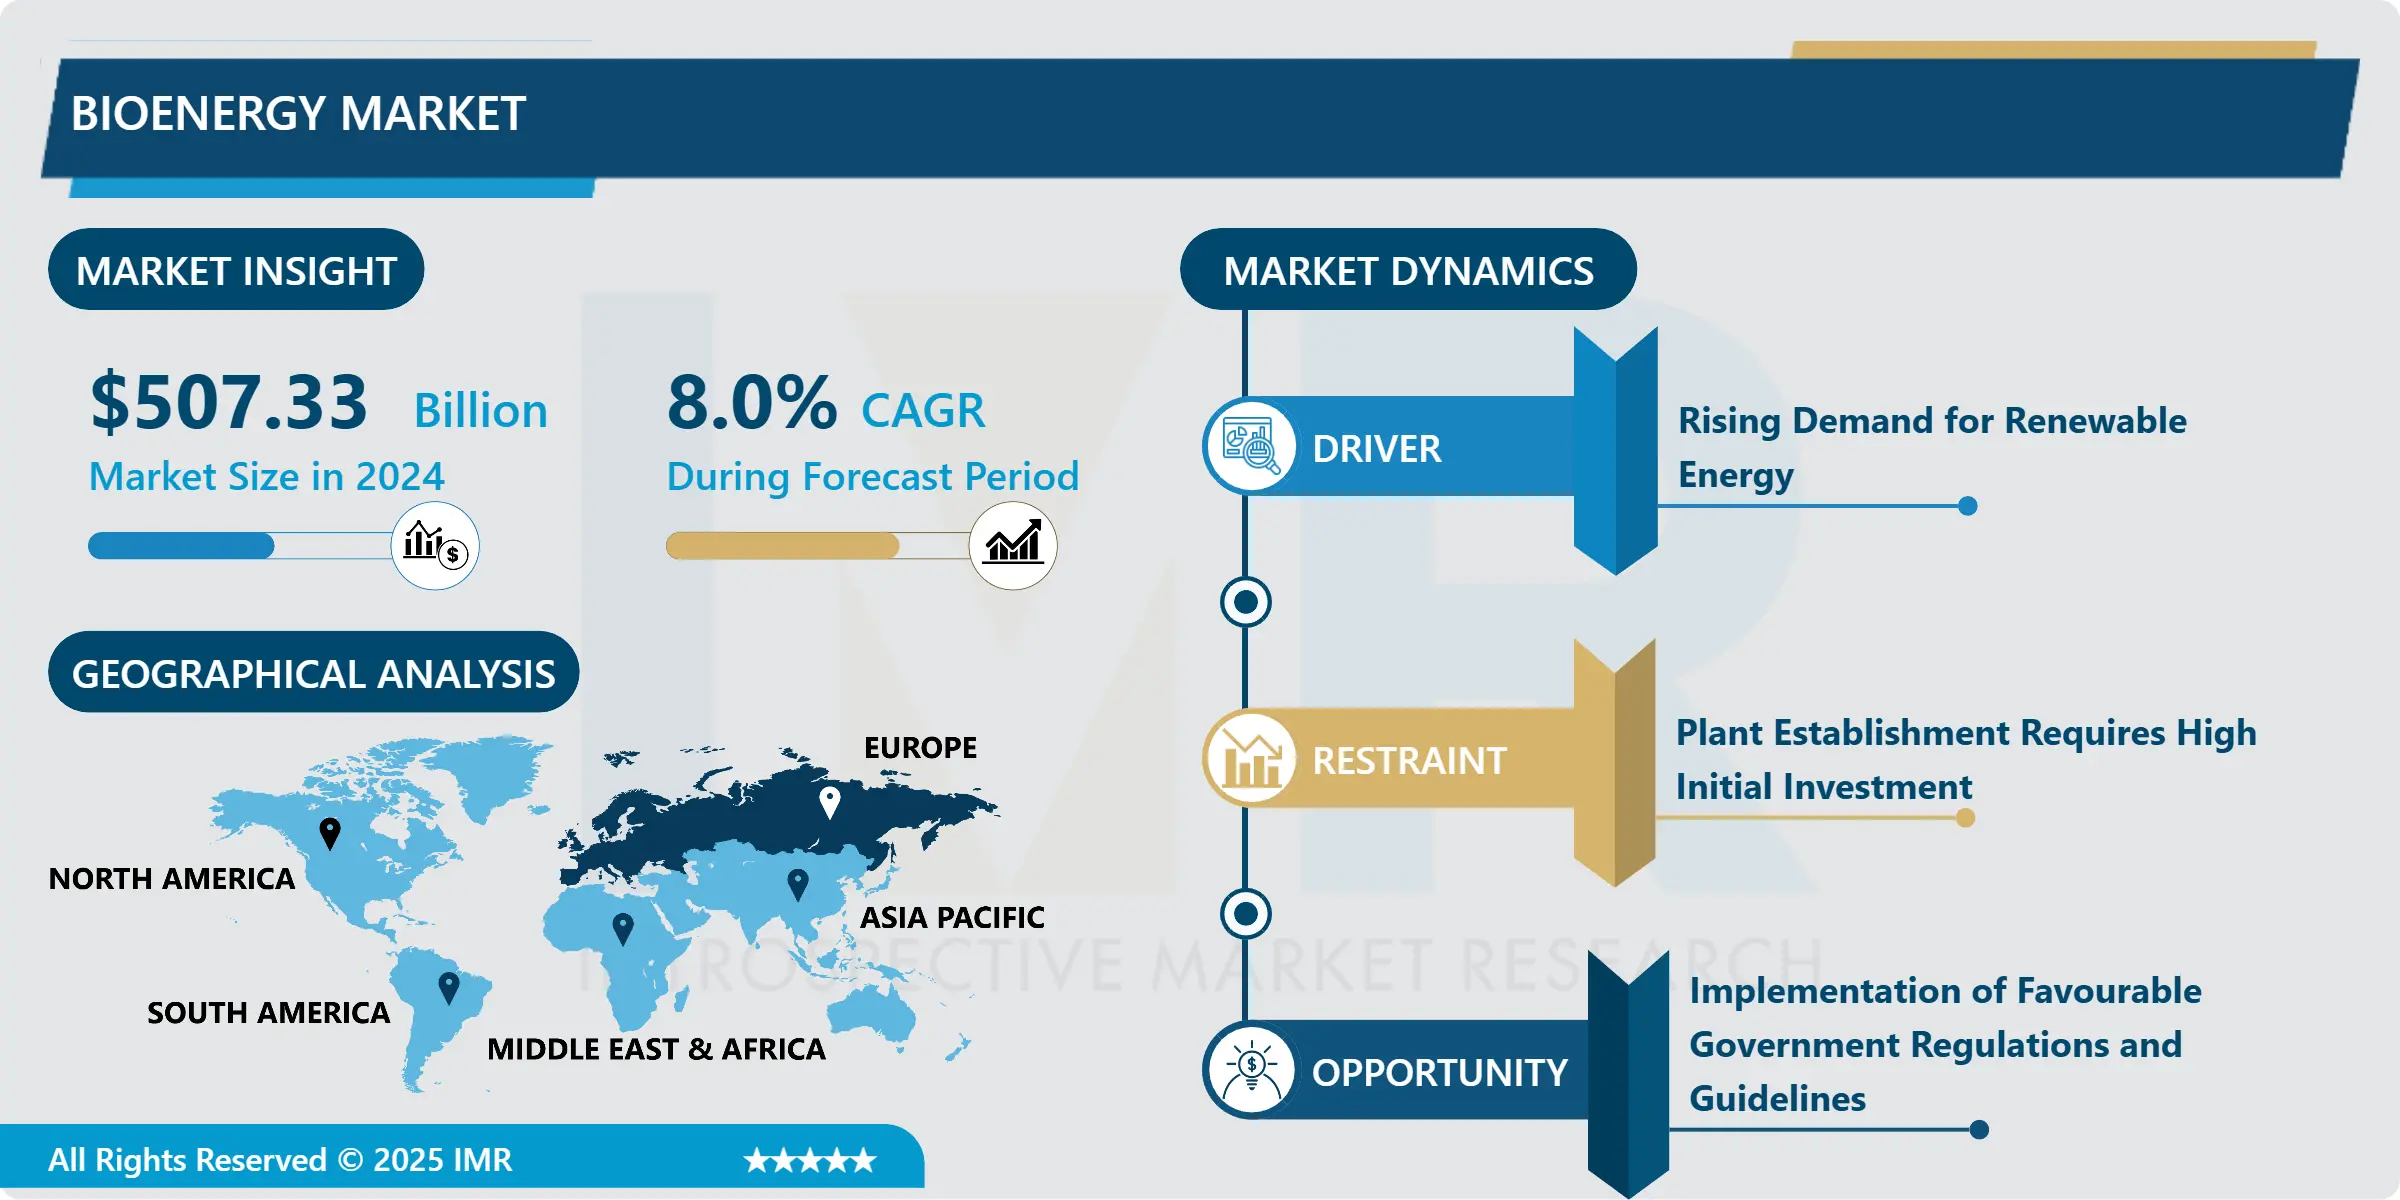
The Global Bioenergy Market Size Was Valued At USD 507.33 Billion In 2024 And Is Projected To Reach USD 939.03 Billion By 2032, Growing At a CAGR Of 8.12% From 2025 To 2032.
Bioenergy is one of many different resources available to help meet energy demand. It is a type of renewable energy derived from recently living organic materials known as biomass, and it can be used to generate transportation fuels, heat, electricity, and products. Agriculture and forest residues, energy crops, and algae are all examples of biomass.
The bioenergy market has witnessed significant growth and evolution, driven by increasing global awareness of environmental issues and the need for sustainable energy sources. Bioenergy refers to renewable energy derived from biological sources, such as biomass, biofuels, and biogas. In recent years, the market has seen a surge in demand due to the growing emphasis on reducing greenhouse gas emissions and dependence on fossil fuels.
Biomass, including organic materials like wood, crop residues, and waste, plays a crucial role in bioenergy production. Biofuels, such as ethanol and biodiesel, are gaining prominence as alternatives to traditional fuels, promoting a shift towards cleaner energy solutions. Additionally, biogas generated from organic waste through anaerobic digestion contributes to the diversification of the energy mix.
Government initiatives and policies promoting renewable energy, along with advancements in technology, have spurred investments in the bioenergy sector.

Bioenergy Market Trend Analysis
Bioenergy Market Growth Drivers- Rising Demand for Renewable Energy
- The escalating global demand for renewable energy sources is a pivotal driving force behind the burgeoning bioenergy market. As societies seek sustainable alternatives to conventional fossil fuels, bioenergy emerges as a compelling solution due to its eco-friendly attributes. Bioenergy harnesses the power of organic materials such as biomass, biofuels, and biogas, offering a renewable and low-carbon option for power generation, heating, and transportation.
- Governments worldwide are increasingly recognizing the importance of mitigating climate change and reducing greenhouse gas emissions, leading to substantial investments and supportive policies for the bioenergy sector. Biomass, derived from organic matter like wood, agricultural residues, and waste, serves as a versatile feedstock for bioenergy production. Biofuels, including ethanol and biodiesel, present viable alternatives in the transportation sector, further driving market growth.
- The bioenergy market not only addresses the pressing need for cleaner energy sources but also promotes sustainable agricultural practices and waste management. With ongoing technological advancements and a growing emphasis on environmental conservation, the bioenergy market is poised for continued expansion, contributing significantly to the global transition towards a more sustainable and resilient energy landscape.
Bioenergy Market Opportunities- Implementation of Favourable Government Regulations and Guidelines Creates an Opportunity
- Favorable government regulations and guidelines play a pivotal role in shaping the landscape of the bioenergy market, creating a robust opportunity for growth and development. As governments worldwide increasingly prioritize sustainable and renewable energy sources, the bioenergy sector emerges as a key beneficiary.
- Governments often implement policies that promote the production and utilization of bioenergy, including incentives, subsidies, and mandates for renewable energy adoption. These measures not only drive investment but also encourage innovation in bioenergy technologies. Moreover, stringent environmental regulations and the global commitment to reduce carbon emissions further bolster the bioenergy market's prospects.
- The bioenergy market overview is characterized by a diverse range of sources, including biomass, biofuels, and biogas. With supportive government frameworks, businesses find a conducive environment for research, development, and commercialization of bioenergy solutions. This creates a positive cycle, fostering partnerships between public and private sectors, driving job creation, and contributing to energy security.
Bioenergy Market Segment Analysis:
Bioenergy Market Segmented on the basis of type, application.
By Type, Solid Biomass Segment Is Expected To Dominate The Market During The Forecast Period
- The solid biomass segment's ascendancy can be attributed to several factors. Firstly, solid biomass offers a reliable and established source of renewable energy, with a long history of traditional use. Its versatility enables the production of heat, electricity, and biofuels, addressing diverse energy needs.
- Additionally, solid biomass is considered a carbon-neutral or low-carbon option, as the carbon dioxide released during combustion is offset by the carbon dioxide absorbed by the plants during their growth. This aligns with global efforts to mitigate climate change and reduce carbon emissions.
- Furthermore, advancements in technology have enhanced the efficiency of solid biomass conversion processes, making them more economically viable and environmentally sustainable. Governments and businesses worldwide are increasingly recognizing the potential of solid biomass as a key player in achieving renewable energy targets, further driving its prominence in the bioenergy market.
By Application, heat generation segment held the largest share in 2024
- Heat generation segment is anticipated to assert its dominance, reflecting a pivotal role in the overall industry landscape. Bioenergy, derived from organic materials such as biomass, plays a crucial role in addressing the growing global demand for sustainable and renewable energy sources. The heat generation application involves the utilization of bioenergy for heating purposes, encompassing a diverse range of sectors such as residential, commercial, and industrial.
- One of the key drivers behind the ascendancy of the heat generation segment is the increasing recognition of bioenergy's eco-friendly attributes. As the world grapples with climate change concerns, the emphasis on reducing carbon emissions has intensified, prompting a shift towards cleaner energy alternatives. Bioenergy, in the form of heat generation, provides a viable solution by offering a renewable energy source that mitigates environmental impact.
Bioenergy Market Regional Insights:
Europe is Expected to Dominate the Market Over the Forecast period
- Europe is poised to lead the bioenergy market, reflecting a commitment to sustainable energy sources and environmental concerns. The region's proactive approach towards reducing carbon emissions and achieving renewable energy targets has positioned bioenergy as a key component of its energy mix. Government policies and incentives, such as the European Green Deal, promote the development and utilization of bioenergy technologies.
- The diverse feedstock availability in Europe, including agricultural residues, forestry residues, and organic waste, contributes to the robustness of the bioenergy sector. Advancements in technology have further enhanced the efficiency of bioenergy production processes, making them increasingly competitive in the energy market.
- Investments in research and development, coupled with collaborations between governments, industries, and research institutions, have propelled the innovation and deployment of cutting-edge bioenergy solutions. The emphasis on biofuels, biomethane, and biomass power generation solidifies Europe's position as a frontrunner in the global bioenergy landscape.
Bioenergy Market Top Key Players:
- Ørsted A/S (Denmark)
- Mitsubishi Heavy Industries Ltd. (Japan)
- Fortum Oyj (Finland)
- Neste Corporation (Finland)
- Evoenergy (Australia)
- Green Biologics (Brazil)
- Archer Daniels Midland (ADM) (United States)
- POET Bioproducts (United States)
- Verbio Vereinigte BioEnergie AG (Germany)
- BBI International (Austria)
- Södra Cell AB (Sweden)
- Raizen Energia (Brazil)
- ABENGOA Bioenergy (Spain)
- Neste Oil Marketing Oy (Finland)
- Advanced Biofuels Canada (Canada)
- Drax Group plc (United Kingdom)
- RENOVA (Austria)
- Green Plains Renewable Energy Inc. (Canada)
- Choren Industries (Germany)
- Biotecha UAB (Lithuania)
- Other Active Players
Key Industry Developments in the Bioenergy Market:
- In 2023, Shell announced a $1 billion investment in a joint venture with LanzaTech, a company developing technology to produce jet fuel from sustainable feedstocks like waste biomass. This initiative aims to reduce the carbon footprint of aviation and support the transition to a low-carbon future.
- In 2023, ExxonMobil, a major oil and gas company, partnered with Sapphire Energy to develop and commercialize algae-based biofuels. This collaboration signifies a growing interest from traditional energy companies in exploring renewable energy sources.
|
Global Bioenergy Market |
|||
|
Base Year: |
2024 |
Forecast Period: |
2025-2032 |
|
Historical Data: |
2018 to 2023 |
Market Size in 2024: |
USD 507.33 Bn. |
|
Forecast Period 2024-32 CAGR: |
8.0% |
Market Size in 2032: |
USD 939.03 Bn. |
|
Segments Covered: |
By Type |
|
|
|
By Application |
|
||
|
By Region |
|
||
|
Key Market Drivers: |
|
||
|
Key Market Restraints: |
|
||
|
Key Opportunities: |
|
||
|
Companies Covered in the report: |
|
||
Chapter 1: Introduction
1.1 Scope and Coverage
Chapter 2:Executive Summary
Chapter 3: Market Landscape
3.1 Market Dynamics
3.1.1 Drivers
3.1.2 Restraints
3.1.3 Opportunities
3.1.4 Challenges
3.2 Market Trend Analysis
3.3 PESTLE Analysis
3.4 Porter's Five Forces Analysis
3.5 Industry Value Chain Analysis
3.6 Ecosystem
3.7 Regulatory Landscape
3.8 Price Trend Analysis
3.9 Patent Analysis
3.10 Technology Evolution
3.11 Investment Pockets
3.12 Import-Export Analysis
Chapter 4: Bioenergy Market by Type (2018-2032)
4.1 Bioenergy Market Snapshot and Growth Engine
4.2 Market Overview
4.3 Biogas
4.3.1 Introduction and Market Overview
4.3.2 Historic and Forecasted Market Size in Value USD and Volume Units
4.3.3 Key Market Trends, Growth Factors, and Opportunities
4.3.4 Geographic Segmentation Analysis
4.4 Solid Biomass
4.5 Renewable Waste
Chapter 5: Bioenergy Market by Application (2018-2032)
5.1 Bioenergy Market Snapshot and Growth Engine
5.2 Market Overview
5.3 Power Generation
5.3.1 Introduction and Market Overview
5.3.2 Historic and Forecasted Market Size in Value USD and Volume Units
5.3.3 Key Market Trends, Growth Factors, and Opportunities
5.3.4 Geographic Segmentation Analysis
5.4 Heat Generation
5.5 Transportation
Chapter 6: Company Profiles and Competitive Analysis
6.1 Competitive Landscape
6.1.1 Competitive Benchmarking
6.1.2 Bioenergy Market Share by Manufacturer (2024)
6.1.3 Industry BCG Matrix
6.1.4 Heat Map Analysis
6.1.5 Mergers and Acquisitions
6.2 3M COMPANY (US)
6.2.1 Company Overview
6.2.2 Key Executives
6.2.3 Company Snapshot
6.2.4 Role of the Company in the Market
6.2.5 Sustainability and Social Responsibility
6.2.6 Operating Business Segments
6.2.7 Product Portfolio
6.2.8 Business Performance
6.2.9 Key Strategic Moves and Recent Developments
6.2.10 SWOT Analysis
6.3 ABBOTT LABORATORIES (US)
6.4 BAXTER INTERNATIONAL INC. (US)
6.5 ZIMMER BIOMET HOLDINGS INC. (US)
6.6 COOK MEDICAL (US)
6.7 ELI LILLY AND COMPANY (US)
6.8 BD (BECTON
6.9 DICKINSON AND COMPANY) (US)
6.10 MERCK & COINC. (US)
6.11 PFIZER INC. (US)
6.12 STRYKER CORPORATION (US)
6.13 JOHNSON & JOHNSON (US)
6.14 SANOFI (FRANCE)
6.15 BAYER AG (GERMANY)
6.16 BOEHRINGER INGELHEIM GMBH (GERMANY)
6.17 MEDTRONIC PLC (IRELAND)
6.18 ALKERMES PLC (IRELAND)
6.19 ASTRAZENECA PLC (UK)
6.20 NOVARTIS AG (SWITZERLAND)
6.21 F. HOFFMANN-LA ROCHE LTD. (SWITZERLAND)
6.22 ROCHE HOLDING AG (SWITZERLAND)
6.23 TEVA PHARMACEUTICAL INDUSTRIES LTD. (ISRAEL)
6.24 TERUMO CORPORATION (JAPAN)
6.25 SAMSUNG MEDISON COLTD. (SOUTH KOREA)
Chapter 7: Global Bioenergy Market By Region
7.1 Overview
7.2. North America Bioenergy Market
7.2.1 Key Market Trends, Growth Factors and Opportunities
7.2.2 Top Key Companies
7.2.3 Historic and Forecasted Market Size by Segments
7.2.4 Historic and Forecasted Market Size by Type
7.2.4.1 Biogas
7.2.4.2 Solid Biomass
7.2.4.3 Renewable Waste
7.2.5 Historic and Forecasted Market Size by Application
7.2.5.1 Power Generation
7.2.5.2 Heat Generation
7.2.5.3 Transportation
7.2.6 Historic and Forecast Market Size by Country
7.2.6.1 US
7.2.6.2 Canada
7.2.6.3 Mexico
7.3. Eastern Europe Bioenergy Market
7.3.1 Key Market Trends, Growth Factors and Opportunities
7.3.2 Top Key Companies
7.3.3 Historic and Forecasted Market Size by Segments
7.3.4 Historic and Forecasted Market Size by Type
7.3.4.1 Biogas
7.3.4.2 Solid Biomass
7.3.4.3 Renewable Waste
7.3.5 Historic and Forecasted Market Size by Application
7.3.5.1 Power Generation
7.3.5.2 Heat Generation
7.3.5.3 Transportation
7.3.6 Historic and Forecast Market Size by Country
7.3.6.1 Russia
7.3.6.2 Bulgaria
7.3.6.3 The Czech Republic
7.3.6.4 Hungary
7.3.6.5 Poland
7.3.6.6 Romania
7.3.6.7 Rest of Eastern Europe
7.4. Western Europe Bioenergy Market
7.4.1 Key Market Trends, Growth Factors and Opportunities
7.4.2 Top Key Companies
7.4.3 Historic and Forecasted Market Size by Segments
7.4.4 Historic and Forecasted Market Size by Type
7.4.4.1 Biogas
7.4.4.2 Solid Biomass
7.4.4.3 Renewable Waste
7.4.5 Historic and Forecasted Market Size by Application
7.4.5.1 Power Generation
7.4.5.2 Heat Generation
7.4.5.3 Transportation
7.4.6 Historic and Forecast Market Size by Country
7.4.6.1 Germany
7.4.6.2 UK
7.4.6.3 France
7.4.6.4 The Netherlands
7.4.6.5 Italy
7.4.6.6 Spain
7.4.6.7 Rest of Western Europe
7.5. Asia Pacific Bioenergy Market
7.5.1 Key Market Trends, Growth Factors and Opportunities
7.5.2 Top Key Companies
7.5.3 Historic and Forecasted Market Size by Segments
7.5.4 Historic and Forecasted Market Size by Type
7.5.4.1 Biogas
7.5.4.2 Solid Biomass
7.5.4.3 Renewable Waste
7.5.5 Historic and Forecasted Market Size by Application
7.5.5.1 Power Generation
7.5.5.2 Heat Generation
7.5.5.3 Transportation
7.5.6 Historic and Forecast Market Size by Country
7.5.6.1 China
7.5.6.2 India
7.5.6.3 Japan
7.5.6.4 South Korea
7.5.6.5 Malaysia
7.5.6.6 Thailand
7.5.6.7 Vietnam
7.5.6.8 The Philippines
7.5.6.9 Australia
7.5.6.10 New Zealand
7.5.6.11 Rest of APAC
7.6. Middle East & Africa Bioenergy Market
7.6.1 Key Market Trends, Growth Factors and Opportunities
7.6.2 Top Key Companies
7.6.3 Historic and Forecasted Market Size by Segments
7.6.4 Historic and Forecasted Market Size by Type
7.6.4.1 Biogas
7.6.4.2 Solid Biomass
7.6.4.3 Renewable Waste
7.6.5 Historic and Forecasted Market Size by Application
7.6.5.1 Power Generation
7.6.5.2 Heat Generation
7.6.5.3 Transportation
7.6.6 Historic and Forecast Market Size by Country
7.6.6.1 Turkiye
7.6.6.2 Bahrain
7.6.6.3 Kuwait
7.6.6.4 Saudi Arabia
7.6.6.5 Qatar
7.6.6.6 UAE
7.6.6.7 Israel
7.6.6.8 South Africa
7.7. South America Bioenergy Market
7.7.1 Key Market Trends, Growth Factors and Opportunities
7.7.2 Top Key Companies
7.7.3 Historic and Forecasted Market Size by Segments
7.7.4 Historic and Forecasted Market Size by Type
7.7.4.1 Biogas
7.7.4.2 Solid Biomass
7.7.4.3 Renewable Waste
7.7.5 Historic and Forecasted Market Size by Application
7.7.5.1 Power Generation
7.7.5.2 Heat Generation
7.7.5.3 Transportation
7.7.6 Historic and Forecast Market Size by Country
7.7.6.1 Brazil
7.7.6.2 Argentina
7.7.6.3 Rest of SA
Chapter 8 Analyst Viewpoint and Conclusion
8.1 Recommendations and Concluding Analysis
8.2 Potential Market Strategies
Chapter 9 Research Methodology
9.1 Research Process
9.2 Primary Research
9.3 Secondary Research
|
Global Bioenergy Market |
|||
|
Base Year: |
2024 |
Forecast Period: |
2025-2032 |
|
Historical Data: |
2018 to 2023 |
Market Size in 2024: |
USD 507.33 Bn. |
|
Forecast Period 2024-32 CAGR: |
8.0% |
Market Size in 2032: |
USD 939.03 Bn. |
|
Segments Covered: |
By Type |
|
|
|
By Application |
|
||
|
By Region |
|
||
|
Key Market Drivers: |
|
||
|
Key Market Restraints: |
|
||
|
Key Opportunities: |
|
||
|
Companies Covered in the report: |
|
||


