


Automotive Logistics Market Synopsis
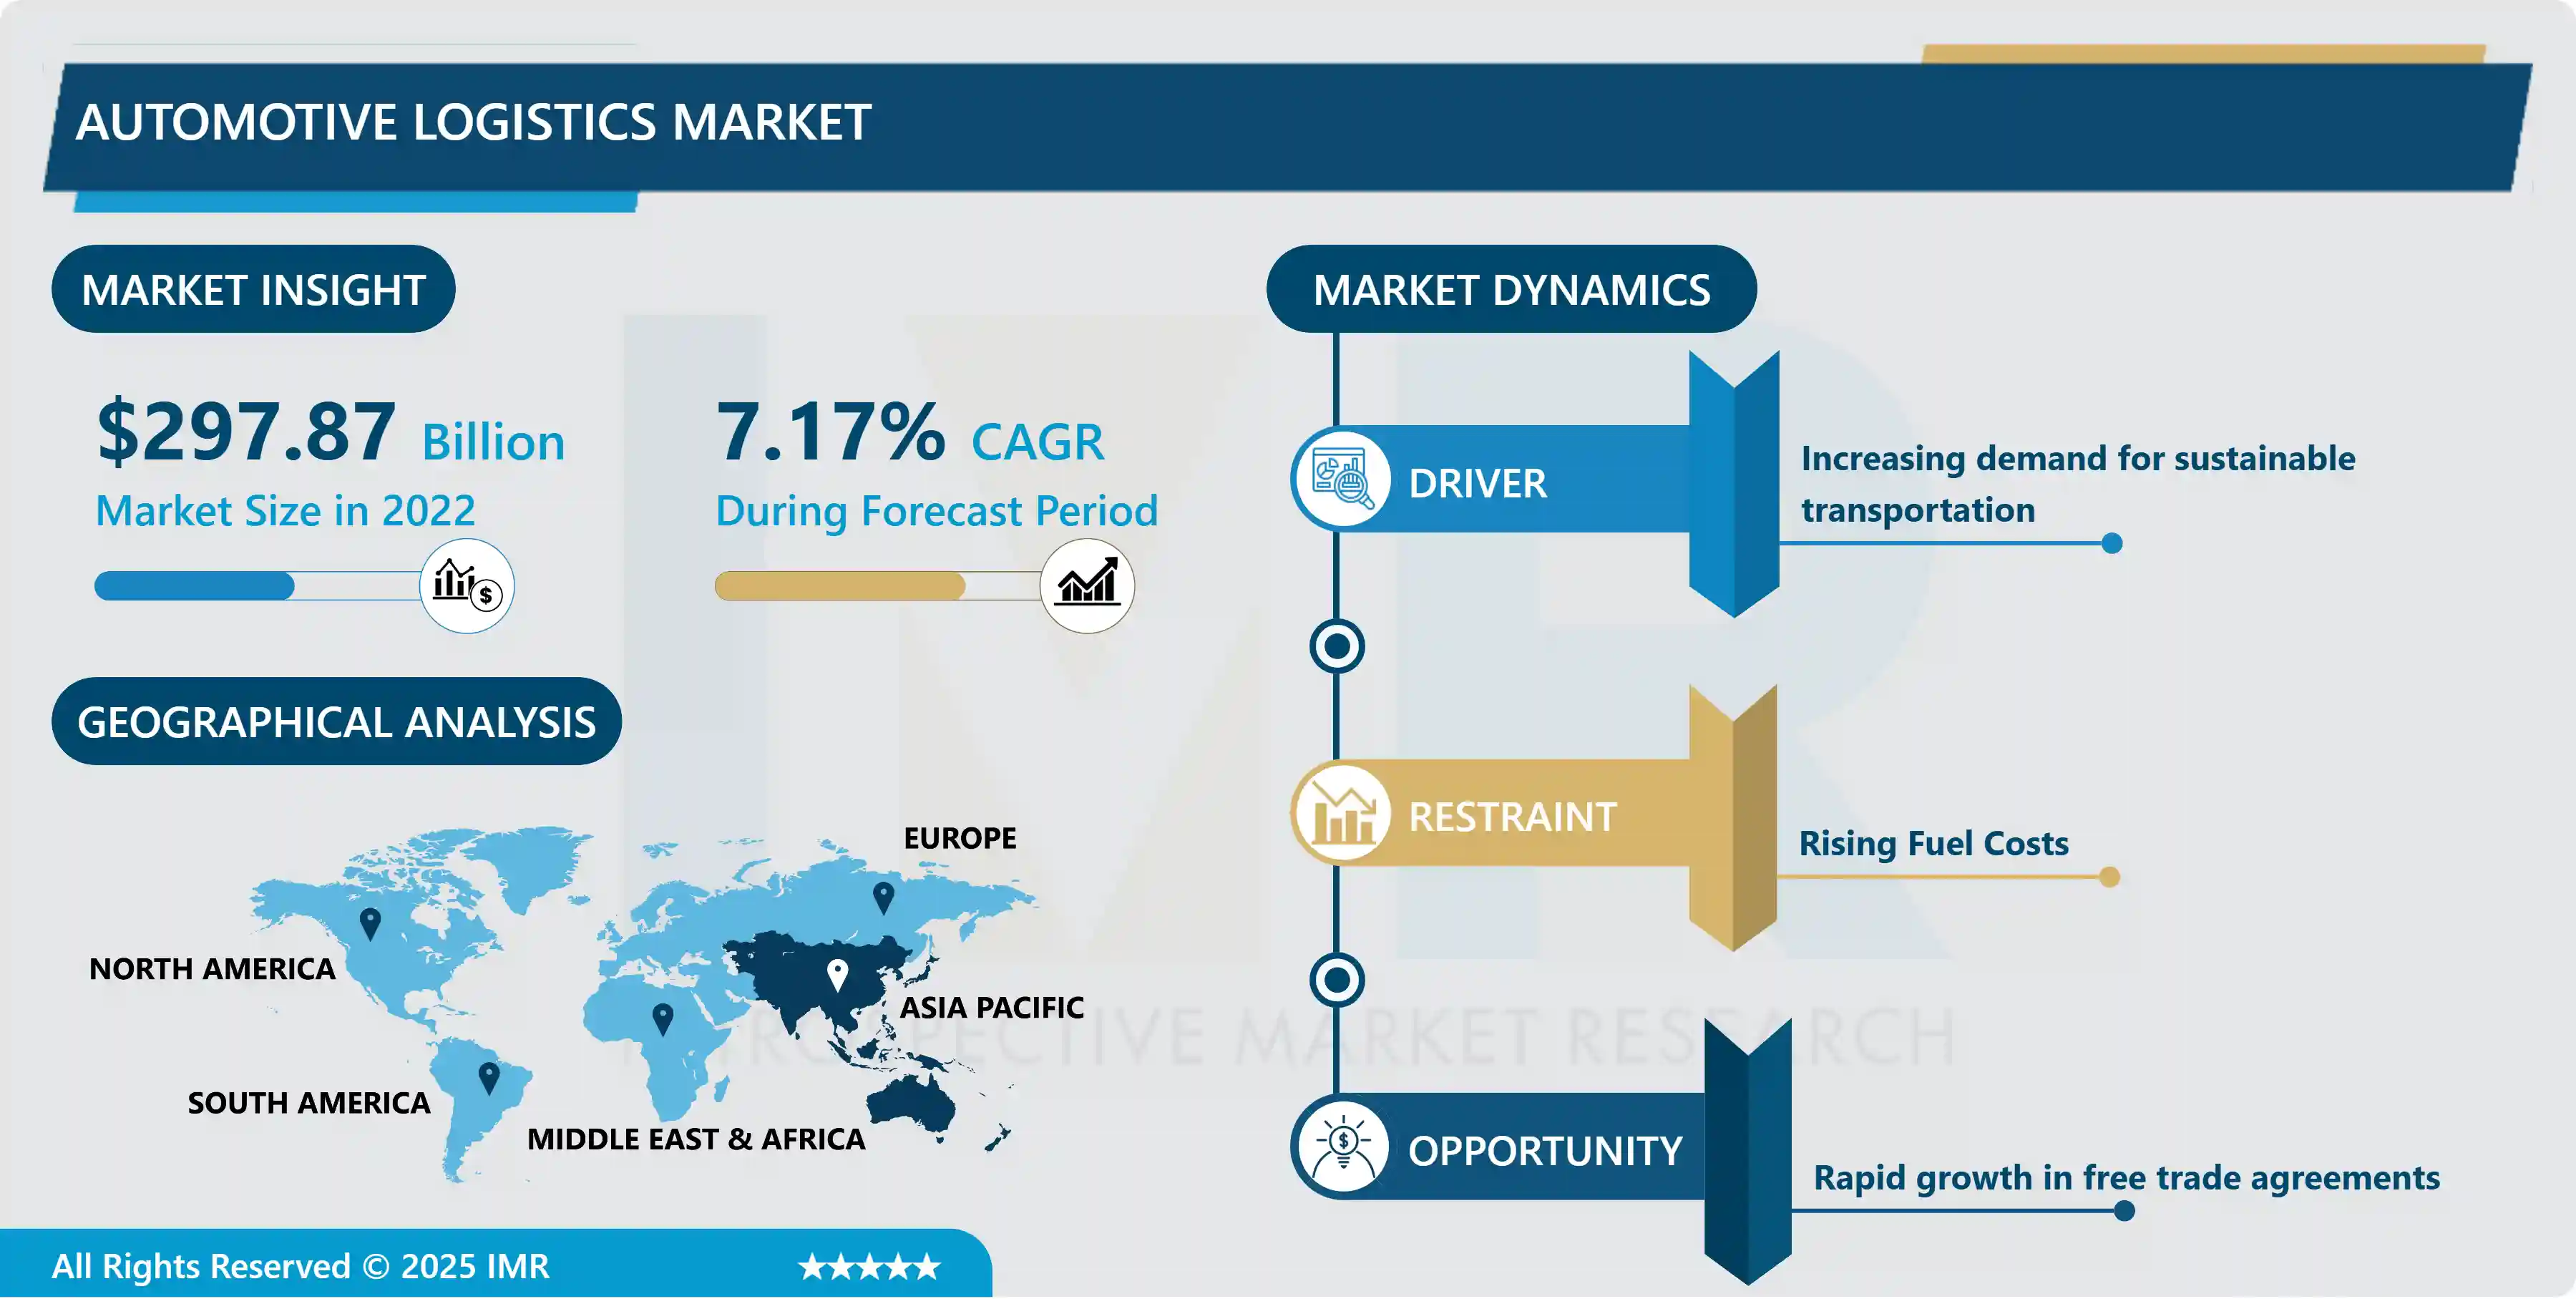
Automotive Logistics Market Size Was Valued at USD 298.21 Billion in 2023 and is Projected to Reach USD 574.14 Billion by 2032, Growing at a CAGR of 7.55 % From 2024-2032.
Automotive logistics involves the planning, coordination, and management of the transportation, storage, and distribution of vehicles, parts, and components throughout the automotive supply chain, from manufacturing plants to dealerships or end customers.
Automotive logistics is a crucial aspect of the automotive industry, encompassing transportation, storage, and distribution processes. It plays a vital role in supply chain management, supporting production by ensuring timely delivery of raw materials, components, and parts to production facilities. It also supports the distribution of finished vehicles from manufacturing plants to dealerships or end customers, coordinating vehicle transport, storage, and delivery using various modes of transportation. Inventory management is also crucial, implementing tracking systems, optimizing storage space, and replenishing stock to meet customer demand while minimizing excess inventory and associated costs.
Reverse logistics processes involve the return, repair, refurbishment, or recycling of defective or end-of-life vehicles, parts, and components. Transportation management involves carrier selection, route optimization, freight consolidation, and tracking and tracing of shipments. Warehousing and distribution activities involve storage, handling, sorting, and packaging of automotive products, facilitating the efficient flow of goods to various destinations. The globalization of the automotive industry has necessitated the need for efficient logistics to manage the flow of parts and finished vehicles. Just-in-time manufacturing, complex supply chains, and high-value goods require specialized services to ensure smooth operations.
Automotive logistics providers offer secure transportation, temperature-controlled storage, and handling of oversized or fragile components. Just-in-sequence (JIS) delivery requires precise coordination and sequencing of deliveries. Customer expectations demand fast and reliable delivery of vehicles, spare parts, and accessories. Automotive logistics providers ensure timely delivery, efficient inventory management, and responsive customer service. The rise of e-commerce and direct-to-consumer sales channels has created new opportunities and challenges in automotive logistics, necessitating logistics partners capable of handling last-mile delivery, reverse logistics, and managing online sales platforms.
Automotive Logistics Market Trend Analysis
Increasing automotive industry globalization
- Increasing automotive industry globalization refers to the trend of automotive manufacturers and suppliers expanding their operations and supply chains across international borders to leverage cost advantages, access new markets, and enhance competitiveness. Automotive companies seek to tap into emerging markets with growing demand for vehicles. By establishing manufacturing facilities and distribution networks in these regions, they can access a larger customer base and increase sales volume.
- Globalization allows automotive companies to optimize costs by sourcing components, parts, and materials from countries with lower production costs. This includes outsourcing manufacturing to regions with cheaper labor, as well as sourcing raw materials and components from suppliers worldwide. Globalization enables automotive companies to design more efficient and resilient supply chains. By diversifying suppliers and production facilities across different regions, they can mitigate risks related to natural disasters, geopolitical tensions, and supply chain disruptions.
- Automotive manufacturers leverage globalization to access talent pools and expertise in engineering, design, manufacturing, and technology development. They establish research and development (R&D) centers and collaborate with universities and research institutions worldwide to innovate and stay competitive. Globalization allows automotive companies to achieve economies of scale by standardizing production processes, sharing platforms and components across different models, and increasing production volumes.
Restraint
Global Supply Chain Complexity
- The global supply chain complexity in automotive logistics presents numerous challenges and obstacles. These include a multi-tiered supply chain, involving diverse stakeholders such as suppliers, manufacturers, distributors, and logistics providers, each with their own processes and objectives. Globalization and outsourcing have led to complexities in managing long-distance transportation, customs procedures, currency fluctuations, and geopolitical risks. Just-in-Time (JIT) manufacturing models, which minimize inventory holding costs but require tight coordination, are also prevalent.
- The complexity of the global automotive supply chain makes it susceptible to supply chain disruptions, such as natural disasters, transportation delays, labor strikes, political instability, and supplier bankruptcies. Regulatory compliance is another challenge, as automotive logistics must adhere to various regulations and standards. Technological challenges, such as managing technology infrastructure, cybersecurity risks, and data integration, also pose additional challenges. Implementing and maintaining compatible systems and software solutions requires significant investment and expertise.
Opportunity
Providing Flexible Delivery Options can Capitalize on the Growing Trend of Online Vehicle Sales
- Automotive logistics can capitalize on the growing trend of online vehicle sales and aftermarket services by offering flexible delivery options. This can enhance customer experience by providing convenience and flexibility to customers who prefer not to visit traditional dealerships or stores. As consumer preferences shift towards online shopping, automotive logistics companies can adapt by providing tailored delivery solutions, such as specific delivery time slots, expedited shipping options, and real-time tracking.
- Flexible delivery options can expand market reach beyond traditional retail locations, reaching customers in remote or underserved areas where access to dealerships or aftermarket stores may be limited. They can also support aftermarket services, such as parts, accessories, and maintenance products, enhancing customer satisfaction and encouraging repeat purchases.
- Offering flexible delivery options can serve as a key differentiator and competitive advantage in a competitive market. As the automotive industry undergoes digital transformation, logistics companies must adapt to new market dynamics and consumer behaviors, aligning with digital retailing and e-commerce.
Challenge
Inadequate or outdated transportation infrastructure
- Inadequate or outdated transportation infrastructure in automotive logistics poses significant challenges and limitations. Congestion on roads, highways, and ports can lead to inefficiencies and increased lead times in logistics operations. Outdated transportation infrastructure may have limited capacity to handle the volume of vehicles and parts required by the automotive industry, causing congestion and delays. Poor connectivity between key production centers, distribution hubs, and markets can hinder the smooth flow of goods and increase transportation costs.
- Infrastructure deterioration, including potholes, structural weaknesses, and outdated technology, can lead to increased maintenance costs, safety concerns, and disruptions in automotive logistics operations. Safety concerns arise from poor road conditions, inadequate signage, and outdated traffic management systems. Limited transportation infrastructure can result in higher transportation costs, longer lead times, and reduced efficiency in automotive logistics operations, negatively impacting the competitiveness of automotive manufacturers and suppliers in global markets.
Automotive Logistics Market Segment Analysis:
Automotive Logistics Market is Segmented based on transport mode, service type, vehicle type, and distribution.
By Transport Mode, Roadways segment is expected to dominate the market during the forecast period
- Road transportation is a crucial last-mile connectivity mode that facilitates the movement of vehicles and parts from manufacturing plants to dealerships and end customers. It offers flexibility, versatility, speed, and timeliness compared to other modes like rail or sea. Road transportation can reach remote locations, navigate urban areas, and accommodate varying shipment sizes and types. It also provides faster transit times and shorter lead times, making it ideal for just-in-time production schedules and customer delivery expectations.
- It also offers door-to-door service, simplifying logistics operations and reducing transit times. Although it may have higher costs per mile for long-distance haulage, it is often more cost-effective for short to medium hauls. The regulatory environment governing road transportation is generally more conducive to logistics operations, with more flexible regulations allowing for efficient and uninterrupted transportation.
By Service Type, Outbound Logistics segment held the largest share of 42% in 2023
- Outbound logistics is the process of distributing finished vehicles from manufacturing plants to dealerships or end customers, involving large volumes of vehicles transported to various destinations. It is complex and involves coordination with multiple stakeholders, including manufacturers, carriers, dealerships, and customers. Efficient outbound logistics operations enhance customer satisfaction and brand loyalty in the automotive industry.
- Automotive manufacturers invest in optimizing their outbound logistics networks to minimize costs, reduce lead times, and maximize vehicle availability. As global automotive markets expand, outbound logistics plays a vital role in reaching new customers. Value-added services like vehicle preparation, inspection, and customization are offered by outbound logistics providers to meet customer requirements. Additionally, aftermarket support is provided by the distribution of aftermarket parts, accessories, and components to dealerships and repair centers.
Automotive Logistics Market Regional Insights:
Asia Pacific is Expected to Dominate the Market Over the Forecast Period
- APAC is experiencing rapid growth in the automotive sector due to rising consumer demand, urbanization, and expanding middle-class populations. Countries like China, India, and Southeast Asia are emerging as major manufacturing hubs, producing vehicles for domestic consumption and export. APAC's large market size and strategic location facilitate trade flows between Asia-Pacific countries and other regions. Governments are supporting the automotive industry through policies, incentives, and infrastructure development initiatives.
- The region is also witnessing a surge in demand for electric vehicles (EVs) and alternative fuel vehicles, with countries like China and Japan leading the adoption. Technological advancements in automotive manufacturing and logistics, such as autonomous vehicles, connected logistics systems, and digital supply chain solutions, are transforming the way vehicles and components are transported, tracked, and managed in the region.
Automotive Logistics Market Top Key Players:
- UPS Supply Chain Solutions (US)
- Penske Logistics (US)
- XPO Logistics (US)
- FedEx Supply Chain (US)
- C.H. Robinson (US)
- Expeditors International (US)
- ArcBest Corporation (US)
- Ryder System (US)
- DHL Supply Chain (Germany)
- DB Schenker (Germany)
- Dachser (Germany)
- Hellmann Worldwide Logistics (Germany)
- Bollore Logistics (France)
- Geodis (France)
- SNCF Logistics (France)
- CEVA Logistics (Switzerland)
- Nippon Express (Japan)
- Kintetsu World Express (Japan)
- Hitachi Transport System (Japan)
- Yusen Logistics (Japan)
- KWE Kintetsu World Express (Japan)
- Agility Logistics (Kuwait), and other major players
Key Industry Developments in the Automotive Logistics Market:
- In July 2023, Penske Truck Leasing announced it had recently completed the acquisitions of Star Truck Rentals, Inc., a transportation services company offering full-service leasing, and commercial truck rental, The acquisition of Star Truck Rentals, Inc. increases Penske's existing fleet by approximately 1,900 vehicles and adds 18 locations throughout Michigan and Indiana. The acquisition of Kris-Way Truck Leasing, Inc. increases Penske's existing fleet by approximately 900 vehicles and adds seven locations throughout Maine and New Hampshire.
- In February 2022, Global logistics company C.H. Robinson and Waymo Via, the trucking and local delivery unit of autonomous driving technology company Waymo, formed a long-term strategic partnership to mutually explore the practical application of autonomous driving technology in logistics and supply chains. The partnership combines the benefits of Waymo’s innovative autonomous driving technology. The collaboration will focus, initially, on running multiple pilots in the Dallas-Houston transportation lane, with Waymo Via autonomous trucks hauling C.H. Robinson’s customer freight. the companies will collaborate to shape the future development and expansion of autonomous driving technology as an additional transportation solution.
|
Automotive Logistics Market |
|||
|
Base Year: |
2023 |
Forecast Period: |
2024-2032 |
|
Historical Data: |
2017 to 2023 |
Market Size in 2023: |
USD 298.21 Bn. |
|
Forecast Period 2024-32 CAGR: |
7.17% |
Market Size in 2032: |
USD 574.14 Bn. |
|
Segments Covered: |
By Type |
|
|
|
By Service |
|
||
|
By Mode of Transport |
|
||
|
By Region |
|
||
|
Key Market Drivers: |
|
||
|
Key Market Restraints: |
|
||
|
Key Opportunities: |
|
||
|
Companies Covered in the Report: |
|
||
Chapter 1: Introduction
1.1 Scope and Coverage
Chapter 2:Executive Summary
Chapter 3: Market Landscape
3.1 Market Dynamics
3.1.1 Drivers
3.1.2 Restraints
3.1.3 Opportunities
3.1.4 Challenges
3.2 Market Trend Analysis
3.3 PESTLE Analysis
3.4 Porter's Five Forces Analysis
3.5 Industry Value Chain Analysis
3.6 Ecosystem
3.7 Regulatory Landscape
3.8 Price Trend Analysis
3.9 Patent Analysis
3.10 Technology Evolution
3.11 Investment Pockets
3.12 Import-Export Analysis
Chapter 4: Automotive Logistics Market by Type (2018-2032)
4.1 Automotive Logistics Market Snapshot and Growth Engine
4.2 Market Overview
4.3 Automobile Parts
4.3.1 Introduction and Market Overview
4.3.2 Historic and Forecasted Market Size in Value USD and Volume Units
4.3.3 Key Market Trends, Growth Factors, and Opportunities
4.3.4 Geographic Segmentation Analysis
4.4 Finished Vehicles.
Chapter 5: Automotive Logistics Market by Service (2018-2032)
5.1 Automotive Logistics Market Snapshot and Growth Engine
5.2 Market Overview
5.3 Transportation
5.3.1 Introduction and Market Overview
5.3.2 Historic and Forecasted Market Size in Value USD and Volume Units
5.3.3 Key Market Trends, Growth Factors, and Opportunities
5.3.4 Geographic Segmentation Analysis
5.4 Warehousing
5.5 Distribution
5.6 Inventory Management.
Chapter 6: Automotive Logistics Market by Mode of Transport (2018-2032)
6.1 Automotive Logistics Market Snapshot and Growth Engine
6.2 Market Overview
6.3 Roadways
6.3.1 Introduction and Market Overview
6.3.2 Historic and Forecasted Market Size in Value USD and Volume Units
6.3.3 Key Market Trends, Growth Factors, and Opportunities
6.3.4 Geographic Segmentation Analysis
6.4 Airways
6.5 Maritime
6.6 Railways
Chapter 7: Company Profiles and Competitive Analysis
7.1 Competitive Landscape
7.1.1 Competitive Benchmarking
7.1.2 Automotive Logistics Market Share by Manufacturer (2024)
7.1.3 Industry BCG Matrix
7.1.4 Heat Map Analysis
7.1.5 Mergers and Acquisitions
7.2 SERENOVA (UNITED STATE)
7.2.1 Company Overview
7.2.2 Key Executives
7.2.3 Company Snapshot
7.2.4 Role of the Company in the Market
7.2.5 Sustainability and Social Responsibility
7.2.6 Operating Business Segments
7.2.7 Product Portfolio
7.2.8 Business Performance
7.2.9 Key Strategic Moves and Recent Developments
7.2.10 SWOT Analysis
7.3 CONTENT GURU (UNITED STATE)
7.4 GENESYS TELECOMMUNICATIONS LABORATORIES INC. (UNITED STATES)
7.5 AMEYO (INDIA)
7.6 SERVETEL (INDIA)
7.7 NEODOVE (INDIA)
7.8
7.9 ALVARIA (UNITED STATES)
7.10 AIRCALL SAS (UNITED STATES)
7.11 RINGCENTRAL INC. (UNITED STATES)
7.12 AMAZON WEB SERVICES INC. (UNITED STATES)
7.13 METASWITCH NETWORKS LTD. (UNITED KINGDOM)
7.14 VOCALCOM GROUP (FRANCE)
7.15 CISCO SYSTEMS INC. (UNITED STATES)
7.16 FIVE9 INC. (UNITED STATES)
7.17 ORACLE CORPORATION (UNITED STATES)
7.18 EXOTEL TECHCOM PVT. LTD. (INDIA)
7.19 TCN INC. (UNITED STATES)
7.20 AVAYA INC. (UNITED STATES)
7.21 NICE LTD. (ISRAEL)
7.22 TATA CONSULTANCY SERVICES LIMITED. (INDIA)
7.23 3CLOGIC SOFTWARE INC. (MARYLAND)
7.24 ASPECT SOFTWARE INC. (INDIA)
7.25 TALKDESK INC (UNITED STATES)
7.26 WORLDLINE (FRANCE)
7.27 8X8 INC. (UNITED STATES)
Chapter 8: Global Automotive Logistics Market By Region
8.1 Overview
8.2. North America Automotive Logistics Market
8.2.1 Key Market Trends, Growth Factors and Opportunities
8.2.2 Top Key Companies
8.2.3 Historic and Forecasted Market Size by Segments
8.2.4 Historic and Forecasted Market Size by Type
8.2.4.1 Automobile Parts
8.2.4.2 Finished Vehicles.
8.2.5 Historic and Forecasted Market Size by Service
8.2.5.1 Transportation
8.2.5.2 Warehousing
8.2.5.3 Distribution
8.2.5.4 Inventory Management.
8.2.6 Historic and Forecasted Market Size by Mode of Transport
8.2.6.1 Roadways
8.2.6.2 Airways
8.2.6.3 Maritime
8.2.6.4 Railways
8.2.7 Historic and Forecast Market Size by Country
8.2.7.1 US
8.2.7.2 Canada
8.2.7.3 Mexico
8.3. Eastern Europe Automotive Logistics Market
8.3.1 Key Market Trends, Growth Factors and Opportunities
8.3.2 Top Key Companies
8.3.3 Historic and Forecasted Market Size by Segments
8.3.4 Historic and Forecasted Market Size by Type
8.3.4.1 Automobile Parts
8.3.4.2 Finished Vehicles.
8.3.5 Historic and Forecasted Market Size by Service
8.3.5.1 Transportation
8.3.5.2 Warehousing
8.3.5.3 Distribution
8.3.5.4 Inventory Management.
8.3.6 Historic and Forecasted Market Size by Mode of Transport
8.3.6.1 Roadways
8.3.6.2 Airways
8.3.6.3 Maritime
8.3.6.4 Railways
8.3.7 Historic and Forecast Market Size by Country
8.3.7.1 Russia
8.3.7.2 Bulgaria
8.3.7.3 The Czech Republic
8.3.7.4 Hungary
8.3.7.5 Poland
8.3.7.6 Romania
8.3.7.7 Rest of Eastern Europe
8.4. Western Europe Automotive Logistics Market
8.4.1 Key Market Trends, Growth Factors and Opportunities
8.4.2 Top Key Companies
8.4.3 Historic and Forecasted Market Size by Segments
8.4.4 Historic and Forecasted Market Size by Type
8.4.4.1 Automobile Parts
8.4.4.2 Finished Vehicles.
8.4.5 Historic and Forecasted Market Size by Service
8.4.5.1 Transportation
8.4.5.2 Warehousing
8.4.5.3 Distribution
8.4.5.4 Inventory Management.
8.4.6 Historic and Forecasted Market Size by Mode of Transport
8.4.6.1 Roadways
8.4.6.2 Airways
8.4.6.3 Maritime
8.4.6.4 Railways
8.4.7 Historic and Forecast Market Size by Country
8.4.7.1 Germany
8.4.7.2 UK
8.4.7.3 France
8.4.7.4 The Netherlands
8.4.7.5 Italy
8.4.7.6 Spain
8.4.7.7 Rest of Western Europe
8.5. Asia Pacific Automotive Logistics Market
8.5.1 Key Market Trends, Growth Factors and Opportunities
8.5.2 Top Key Companies
8.5.3 Historic and Forecasted Market Size by Segments
8.5.4 Historic and Forecasted Market Size by Type
8.5.4.1 Automobile Parts
8.5.4.2 Finished Vehicles.
8.5.5 Historic and Forecasted Market Size by Service
8.5.5.1 Transportation
8.5.5.2 Warehousing
8.5.5.3 Distribution
8.5.5.4 Inventory Management.
8.5.6 Historic and Forecasted Market Size by Mode of Transport
8.5.6.1 Roadways
8.5.6.2 Airways
8.5.6.3 Maritime
8.5.6.4 Railways
8.5.7 Historic and Forecast Market Size by Country
8.5.7.1 China
8.5.7.2 India
8.5.7.3 Japan
8.5.7.4 South Korea
8.5.7.5 Malaysia
8.5.7.6 Thailand
8.5.7.7 Vietnam
8.5.7.8 The Philippines
8.5.7.9 Australia
8.5.7.10 New Zealand
8.5.7.11 Rest of APAC
8.6. Middle East & Africa Automotive Logistics Market
8.6.1 Key Market Trends, Growth Factors and Opportunities
8.6.2 Top Key Companies
8.6.3 Historic and Forecasted Market Size by Segments
8.6.4 Historic and Forecasted Market Size by Type
8.6.4.1 Automobile Parts
8.6.4.2 Finished Vehicles.
8.6.5 Historic and Forecasted Market Size by Service
8.6.5.1 Transportation
8.6.5.2 Warehousing
8.6.5.3 Distribution
8.6.5.4 Inventory Management.
8.6.6 Historic and Forecasted Market Size by Mode of Transport
8.6.6.1 Roadways
8.6.6.2 Airways
8.6.6.3 Maritime
8.6.6.4 Railways
8.6.7 Historic and Forecast Market Size by Country
8.6.7.1 Turkiye
8.6.7.2 Bahrain
8.6.7.3 Kuwait
8.6.7.4 Saudi Arabia
8.6.7.5 Qatar
8.6.7.6 UAE
8.6.7.7 Israel
8.6.7.8 South Africa
8.7. South America Automotive Logistics Market
8.7.1 Key Market Trends, Growth Factors and Opportunities
8.7.2 Top Key Companies
8.7.3 Historic and Forecasted Market Size by Segments
8.7.4 Historic and Forecasted Market Size by Type
8.7.4.1 Automobile Parts
8.7.4.2 Finished Vehicles.
8.7.5 Historic and Forecasted Market Size by Service
8.7.5.1 Transportation
8.7.5.2 Warehousing
8.7.5.3 Distribution
8.7.5.4 Inventory Management.
8.7.6 Historic and Forecasted Market Size by Mode of Transport
8.7.6.1 Roadways
8.7.6.2 Airways
8.7.6.3 Maritime
8.7.6.4 Railways
8.7.7 Historic and Forecast Market Size by Country
8.7.7.1 Brazil
8.7.7.2 Argentina
8.7.7.3 Rest of SA
Chapter 9 Analyst Viewpoint and Conclusion
9.1 Recommendations and Concluding Analysis
9.2 Potential Market Strategies
Chapter 10 Research Methodology
10.1 Research Process
10.2 Primary Research
10.3 Secondary Research
|
Automotive Logistics Market |
|||
|
Base Year: |
2023 |
Forecast Period: |
2024-2032 |
|
Historical Data: |
2017 to 2023 |
Market Size in 2023: |
USD 298.21 Bn. |
|
Forecast Period 2024-32 CAGR: |
7.17% |
Market Size in 2032: |
USD 574.14 Bn. |
|
Segments Covered: |
By Type |
|
|
|
By Service |
|
||
|
By Mode of Transport |
|
||
|
By Region |
|
||
|
Key Market Drivers: |
|
||
|
Key Market Restraints: |
|
||
|
Key Opportunities: |
|
||
|
Companies Covered in the Report: |
|
||


