


Agricultural Testing Market Synopsis
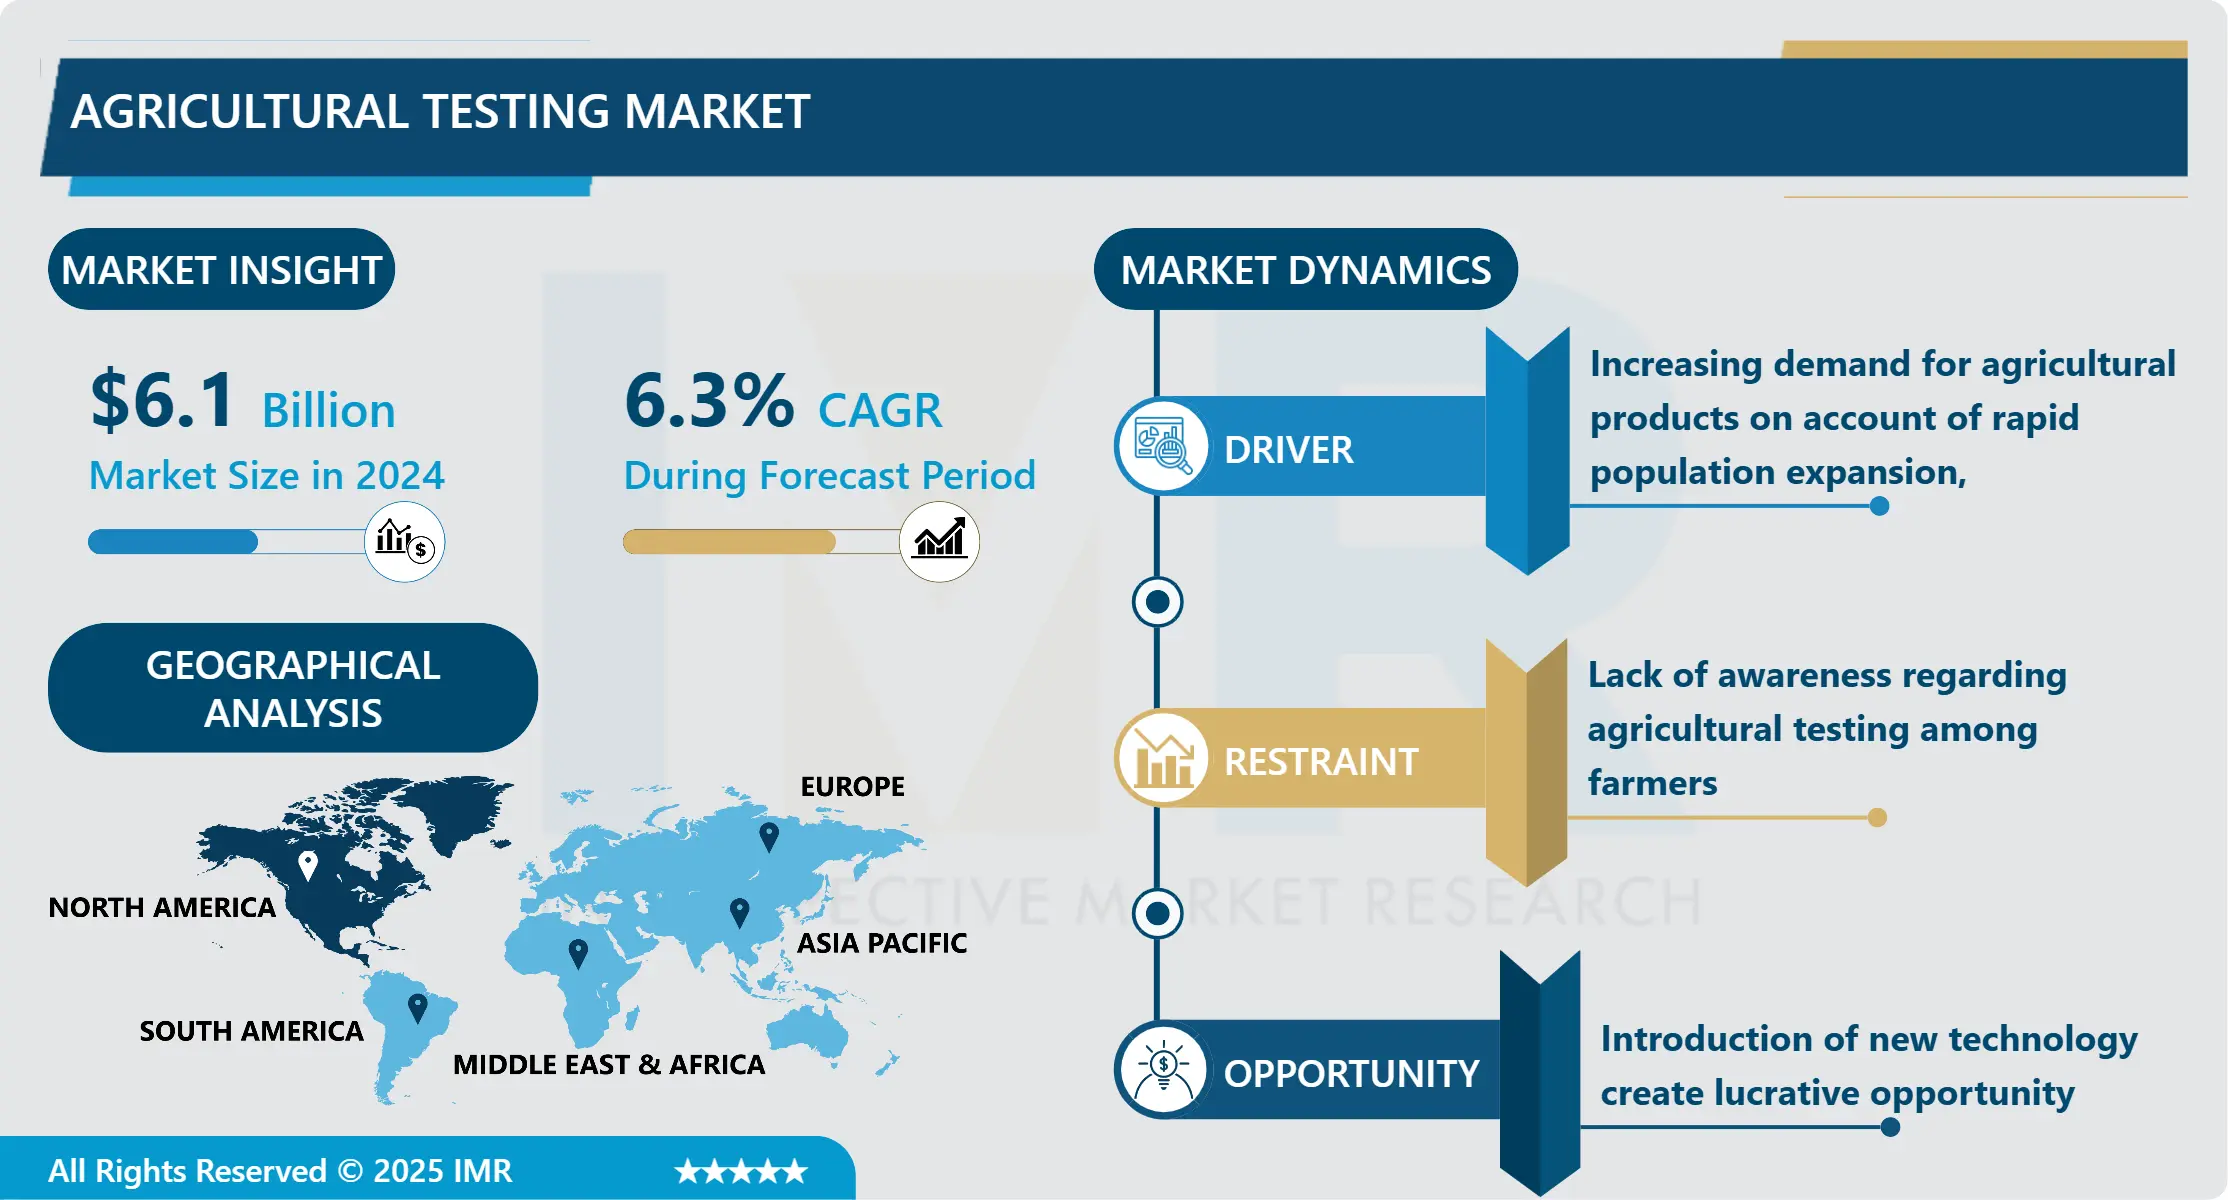
Agricultural Testing Market Size Was Valued at USD 6.1 Billion in 2024, and is Projected to Reach USD 10.6 Billion by 2032, Growing at a CAGR of 6.3% From 2025-2032.
Agriculture testing means that it is the process of testing and determining the levels of contaminant and quality of the water, seed, and soil. It proved useful in determining the appropriate resources and inputs which comprises of compositions, moisture, fertility, acidity and pH level in promoting crop productivity. Agriculture testing entails bio-solid, manure, seed, soil and water testing whereby the primary aim is to establish fertility level for seeds and analytical water quality for irrigation. This is also helping farmers, municipalities, and environmental agencies in choosing optimal fertilizers for improving crop production, crop quality, crop profitability, and distribution of nutrients across a field.
Main factors which contribute to the growth of agriculture testing industry include: the rising population density across the world, coupled with rising income levels, urbanization and industrialization, especially in the developing world leading to the increased consumption of agricultural products.
Agriculture testing helps ensure crops are grown through genetic engineering, in addition to ensuring that the ingredients used are of the highest quality. Furthermore, the Rising incidence of different food borne ailments such as reactive arthritis, cancer, kidney and liver failure along with the brain and neural disorders are fostering the demand for agriculture testing all over the world. Besides this, the growing cases of direct disposal of untreated industrial effluents and residual wastes into the environment have led the governments of different nations to regularly conduct soil testing, which in turn is helping to improve the safety and quality of the Agricultural produce.
Further, the new technologies with the help of IoT and AI have been recently incorporated to have real-time data of the remoteness, inadequately treated fields and all these are strictly boosting the market growthBesides this, higher R & D efforts coupled with sound, more advanced laboratories to adequately check samples and commercial farming to expand the market are identifying positive indications.
The market for agricultural testing is on the rise due to increasing concerns of food security and better practices among farmers. Thus, the effective population and fast-growing rate of urbanization make people more concerned about food safety. Furthermore, pollutants in water and land used in agriculture are also increasing the need for testing to determine how contaminated agricultural produce is. All these factors are expected to enhance the growth of the market.

Agricultural Testing Market Trend Analysis
Rising concern over food safety and sustainable practices
- Growing concern over food safety and sustainable practices: Rising awareness of food safety and ballpark sustainable agricultural practices will continue to fuel the agricultural testing market. Today, people face unprecedented problems in the context of equitable use of resources in different countries, such as depletion of water resources, drought, water shortages, land degradation, pollution, and loss of biological diversity and rapid climate change. These are all issues that are impacting on the future of food and agriculture, food security system and the small farmers. However, in order to reduce or eliminate the above mentioned challenges, testing plays a crucial role in enhancing human lives.
Increasing regulations and frameworks related to agricultural and environmental safety
- The rising incidence of rules and regulations concerning the safety of agricultural foods and the environmental setting are yet again propelling the market growth. Federal Seed Act (FSA), 2020: Global Market Seeds Requirements; Germination; Seed Purity; and Details of treated Seeds for instance; Agric and Vegetable seeds shipment. In the United States, the Environmental Protection Agency (EPA) which is under the Federal Insecticide, Fungicide, and Rodenticide Act (FIFRA) oversees regulations covering pesticide registration, production as well as distribution.
Agricultural Testing Market Segment Analysis:
Agricultural Testing Market is segmented based on Sample, Application and Technology.
By Sample, Soil segment is expected to dominate the market during the forecast period
- It is estimated that there will be a considerable market growth in the sector of agricultural testing during the course of the next year because of the rising interest in soil quality, availability of water sources, and effectiveness of crops. This has been fostered by factors like the need for more sustainable agricultural practices, the increasing importance of high standard food safety standards, and the increasing awareness among farmers concerning testing. Within the sample types presented, the use of soil testing is expected to rise and occupy the largest share within the market. This is because of its function in; soil fertility and the distribution of fertility enabling the right usage of fertilizers, crop health; which affects yields and quality. Automative and more efficient techniques used in soil testing and the adoption of new technologies such as precision farming increases the uptake of soil testing services.
By Application, Quality Assurance segment held the largest share in 2023
- When it comes to the application, the Quality Assurance segment was the largest in 2023. The projection of the Agricultural Testing Service in the following year is high because of the pressing need to enhance the quality and safety of agricultural products. Quality Assurance helps to guarantee that crops meet the required quality and standards to satisfy consumers and other buyers in the market. Moreover, with awareness among consumers regarding the kind of food they intake and regulations regarding food products, Safety Testing has emerged as a necessity to detect and control hazards in agricultural produce. As such, the emphasis on quality and safety will continue to fuel the need for efficient testing services to be incorporated into the market.
Agricultural Testing Market Regional Insights:
North America is Expected to Dominate the Market Over the Forecast period
- North America is expected to be the largest market for agricultural testing during the forecast period due to the presence of increased demand for agricultural testing products and services. Reporting the Coherent Market Insights, the agricultural testing market in the U. S. has been valued to US$ 1,053. It estimated as US $ 756 million in 2016 and is expected to reach US $ 3 million in 2020. Exhibit 2 Market Size: By type The market will grow $1 million by 2026, registering a CAGR of 6. The milk production is estimated to grow at a CAGR of around 8% during the forecast period. Moreover, the regional market is bolstered by the seed regulatory testing division, which tests agricultural and vegetable seeds for marketing efficiency of seeds.
Active Key Players in the Agricultural Testing Market
- Eurofins Scientific
- Agilent Technologies Inc,
- SCS Global Services
- Bureau Veritas SA
- ALS Limited
- Element Materials Technology (EXOVA)
- TUV Nord Group
- Apal Agricultural Laboratory
- Intertek Group PLC
- EMD Millipore Corporation (Millipore Sigma)
- BioMerieux SA
- Aurea AgroSciences
- 3M Company
- Charm Sciences Inc.
- Neogen Corporation
- Biolumix
- Other Active Players
Key Industry Developments in the Agricultural Testing Market:
- In October 2023, BhoomiSeva, a prominent distributor of "Bhu-Vision," an advanced automated soil testing platform, has unveiled its Soil Health Card Project, heralding a transformative impact on agriculture. This ambitious endeavor seeks to pioneer sustainable farming practices in India. With approximately 80 potential stockists poised to adopt this innovative initiative, the outlook for Indian agriculture appears exceedingly optimistic
- In April 2023, Eurofins expanded its portfolio by acquiring Inlabtech AG, a Swiss firm renowned for manufacturing microbiological testing equipment. This strategic acquisition enhances Eurofins' capabilities in the field of testing equipment, marking a significant step towards strengthening its market position.
- In February 2023, Hill Laboratories has entered a joint partnership with Merieux Nutrisciences. This collaboration will see Hill Laboratories' team joining forces with experts from Mérieux NutriSciences to deliver extensive solutions to food businesses in New Zealand.
|
Global Agricultural Testing Market |
|||
|
Base Year: |
2024 |
Forecast Period: |
2025-2032 |
|
Historical Data: |
2018 to 2023 |
Market Size in 2024: |
USD 6.1 Bn. |
|
Forecast Period 2025-32 CAGR: |
6.3 % |
Market Size in 2032: |
USD 10.6 Bn. |
|
Segments Covered: |
By Sample |
|
|
|
By Application |
|
||
|
By Technology |
|
||
|
By Region |
|
||
|
Key Market Drivers: |
|
||
|
Key Market Restraints: |
|
||
|
Key Opportunities: |
|
||
|
Companies Covered in the report: |
|
||
Chapter 1: Introduction
1.1 Scope and Coverage
Chapter 2:Executive Summary
Chapter 3: Market Landscape
3.1 Market Dynamics
3.1.1 Drivers
3.1.2 Restraints
3.1.3 Opportunities
3.1.4 Challenges
3.2 Market Trend Analysis
3.3 PESTLE Analysis
3.4 Porter's Five Forces Analysis
3.5 Industry Value Chain Analysis
3.6 Ecosystem
3.7 Regulatory Landscape
3.8 Price Trend Analysis
3.9 Patent Analysis
3.10 Technology Evolution
3.11 Investment Pockets
3.12 Import-Export Analysis
Chapter 4: Agricultural Testing Market by Sample (2018-2032)
4.1 Agricultural Testing Market Snapshot and Growth Engine
4.2 Market Overview
4.3 Soil
4.3.1 Introduction and Market Overview
4.3.2 Historic and Forecasted Market Size in Value USD and Volume Units
4.3.3 Key Market Trends, Growth Factors, and Opportunities
4.3.4 Geographic Segmentation Analysis
4.4 water
4.5 Seed
4.6 Plant tissue
4.7 Manager
4.8 Biosolids
Chapter 5: Agricultural Testing Market by Application (2018-2032)
5.1 Agricultural Testing Market Snapshot and Growth Engine
5.2 Market Overview
5.3 Quality assurance
5.3.1 Introduction and Market Overview
5.3.2 Historic and Forecasted Market Size in Value USD and Volume Units
5.3.3 Key Market Trends, Growth Factors, and Opportunities
5.3.4 Geographic Segmentation Analysis
5.4 Safety testing
Chapter 6: Agricultural Testing Market by Technology (2018-2032)
6.1 Agricultural Testing Market Snapshot and Growth Engine
6.2 Market Overview
6.3 Rapid technology
6.3.1 Introduction and Market Overview
6.3.2 Historic and Forecasted Market Size in Value USD and Volume Units
6.3.3 Key Market Trends, Growth Factors, and Opportunities
6.3.4 Geographic Segmentation Analysis
6.4 Conventional technology
Chapter 7: Company Profiles and Competitive Analysis
7.1 Competitive Landscape
7.1.1 Competitive Benchmarking
7.1.2 Agricultural Testing Market Share by Manufacturer (2024)
7.1.3 Industry BCG Matrix
7.1.4 Heat Map Analysis
7.1.5 Mergers and Acquisitions
7.2 BASF SE
7.2.1 Company Overview
7.2.2 Key Executives
7.2.3 Company Snapshot
7.2.4 Role of the Company in the Market
7.2.5 Sustainability and Social Responsibility
7.2.6 Operating Business Segments
7.2.7 Product Portfolio
7.2.8 Business Performance
7.2.9 Key Strategic Moves and Recent Developments
7.2.10 SWOT Analysis
7.3 BGG
7.4 CYANOTECH CORPORATION
7.5 DSM
7.6 FENCHEM
7.7 LYCORED
7.8 PIVEG
7.9 ALGAE TO OMEGA
7.10 WELLGREEN TECHNOLOGY
7.11 CARDAX
7.12 INNOBIO
7.13 ALGA TECHNOLOGIES
7.14 ALGIX
7.15 EID-PARRY LTD
7.16 IGENE BIOTECHNOLOGY
7.17 MICROA AS
7.18 JX NIPPON OIL
7.19 ENERGY CORPORATION
7.20 ASTAREAL INCKUNMING BIOGENIC
7.21 DIVIS LABORATORIES LTDOTSUKA PHARMACEUTICALSANDOTHERS MAJOR PLAYERS
Chapter 8: Global Agricultural Testing Market By Region
8.1 Overview
8.2. North America Agricultural Testing Market
8.2.1 Key Market Trends, Growth Factors and Opportunities
8.2.2 Top Key Companies
8.2.3 Historic and Forecasted Market Size by Segments
8.2.4 Historic and Forecasted Market Size by Sample
8.2.4.1 Soil
8.2.4.2 water
8.2.4.3 Seed
8.2.4.4 Plant tissue
8.2.4.5 Manager
8.2.4.6 Biosolids
8.2.5 Historic and Forecasted Market Size by Application
8.2.5.1 Quality assurance
8.2.5.2 Safety testing
8.2.6 Historic and Forecasted Market Size by Technology
8.2.6.1 Rapid technology
8.2.6.2 Conventional technology
8.2.7 Historic and Forecast Market Size by Country
8.2.7.1 US
8.2.7.2 Canada
8.2.7.3 Mexico
8.3. Eastern Europe Agricultural Testing Market
8.3.1 Key Market Trends, Growth Factors and Opportunities
8.3.2 Top Key Companies
8.3.3 Historic and Forecasted Market Size by Segments
8.3.4 Historic and Forecasted Market Size by Sample
8.3.4.1 Soil
8.3.4.2 water
8.3.4.3 Seed
8.3.4.4 Plant tissue
8.3.4.5 Manager
8.3.4.6 Biosolids
8.3.5 Historic and Forecasted Market Size by Application
8.3.5.1 Quality assurance
8.3.5.2 Safety testing
8.3.6 Historic and Forecasted Market Size by Technology
8.3.6.1 Rapid technology
8.3.6.2 Conventional technology
8.3.7 Historic and Forecast Market Size by Country
8.3.7.1 Russia
8.3.7.2 Bulgaria
8.3.7.3 The Czech Republic
8.3.7.4 Hungary
8.3.7.5 Poland
8.3.7.6 Romania
8.3.7.7 Rest of Eastern Europe
8.4. Western Europe Agricultural Testing Market
8.4.1 Key Market Trends, Growth Factors and Opportunities
8.4.2 Top Key Companies
8.4.3 Historic and Forecasted Market Size by Segments
8.4.4 Historic and Forecasted Market Size by Sample
8.4.4.1 Soil
8.4.4.2 water
8.4.4.3 Seed
8.4.4.4 Plant tissue
8.4.4.5 Manager
8.4.4.6 Biosolids
8.4.5 Historic and Forecasted Market Size by Application
8.4.5.1 Quality assurance
8.4.5.2 Safety testing
8.4.6 Historic and Forecasted Market Size by Technology
8.4.6.1 Rapid technology
8.4.6.2 Conventional technology
8.4.7 Historic and Forecast Market Size by Country
8.4.7.1 Germany
8.4.7.2 UK
8.4.7.3 France
8.4.7.4 The Netherlands
8.4.7.5 Italy
8.4.7.6 Spain
8.4.7.7 Rest of Western Europe
8.5. Asia Pacific Agricultural Testing Market
8.5.1 Key Market Trends, Growth Factors and Opportunities
8.5.2 Top Key Companies
8.5.3 Historic and Forecasted Market Size by Segments
8.5.4 Historic and Forecasted Market Size by Sample
8.5.4.1 Soil
8.5.4.2 water
8.5.4.3 Seed
8.5.4.4 Plant tissue
8.5.4.5 Manager
8.5.4.6 Biosolids
8.5.5 Historic and Forecasted Market Size by Application
8.5.5.1 Quality assurance
8.5.5.2 Safety testing
8.5.6 Historic and Forecasted Market Size by Technology
8.5.6.1 Rapid technology
8.5.6.2 Conventional technology
8.5.7 Historic and Forecast Market Size by Country
8.5.7.1 China
8.5.7.2 India
8.5.7.3 Japan
8.5.7.4 South Korea
8.5.7.5 Malaysia
8.5.7.6 Thailand
8.5.7.7 Vietnam
8.5.7.8 The Philippines
8.5.7.9 Australia
8.5.7.10 New Zealand
8.5.7.11 Rest of APAC
8.6. Middle East & Africa Agricultural Testing Market
8.6.1 Key Market Trends, Growth Factors and Opportunities
8.6.2 Top Key Companies
8.6.3 Historic and Forecasted Market Size by Segments
8.6.4 Historic and Forecasted Market Size by Sample
8.6.4.1 Soil
8.6.4.2 water
8.6.4.3 Seed
8.6.4.4 Plant tissue
8.6.4.5 Manager
8.6.4.6 Biosolids
8.6.5 Historic and Forecasted Market Size by Application
8.6.5.1 Quality assurance
8.6.5.2 Safety testing
8.6.6 Historic and Forecasted Market Size by Technology
8.6.6.1 Rapid technology
8.6.6.2 Conventional technology
8.6.7 Historic and Forecast Market Size by Country
8.6.7.1 Turkiye
8.6.7.2 Bahrain
8.6.7.3 Kuwait
8.6.7.4 Saudi Arabia
8.6.7.5 Qatar
8.6.7.6 UAE
8.6.7.7 Israel
8.6.7.8 South Africa
8.7. South America Agricultural Testing Market
8.7.1 Key Market Trends, Growth Factors and Opportunities
8.7.2 Top Key Companies
8.7.3 Historic and Forecasted Market Size by Segments
8.7.4 Historic and Forecasted Market Size by Sample
8.7.4.1 Soil
8.7.4.2 water
8.7.4.3 Seed
8.7.4.4 Plant tissue
8.7.4.5 Manager
8.7.4.6 Biosolids
8.7.5 Historic and Forecasted Market Size by Application
8.7.5.1 Quality assurance
8.7.5.2 Safety testing
8.7.6 Historic and Forecasted Market Size by Technology
8.7.6.1 Rapid technology
8.7.6.2 Conventional technology
8.7.7 Historic and Forecast Market Size by Country
8.7.7.1 Brazil
8.7.7.2 Argentina
8.7.7.3 Rest of SA
Chapter 9 Analyst Viewpoint and Conclusion
9.1 Recommendations and Concluding Analysis
9.2 Potential Market Strategies
Chapter 10 Research Methodology
10.1 Research Process
10.2 Primary Research
10.3 Secondary Research
|
Global Agricultural Testing Market |
|||
|
Base Year: |
2024 |
Forecast Period: |
2025-2032 |
|
Historical Data: |
2018 to 2023 |
Market Size in 2024: |
USD 6.1 Bn. |
|
Forecast Period 2025-32 CAGR: |
6.3 % |
Market Size in 2032: |
USD 10.6 Bn. |
|
Segments Covered: |
By Sample |
|
|
|
By Application |
|
||
|
By Technology |
|
||
|
By Region |
|
||
|
Key Market Drivers: |
|
||
|
Key Market Restraints: |
|
||
|
Key Opportunities: |
|
||
|
Companies Covered in the report: |
|
||


