


Activated Bleaching Clay Market Synopsis
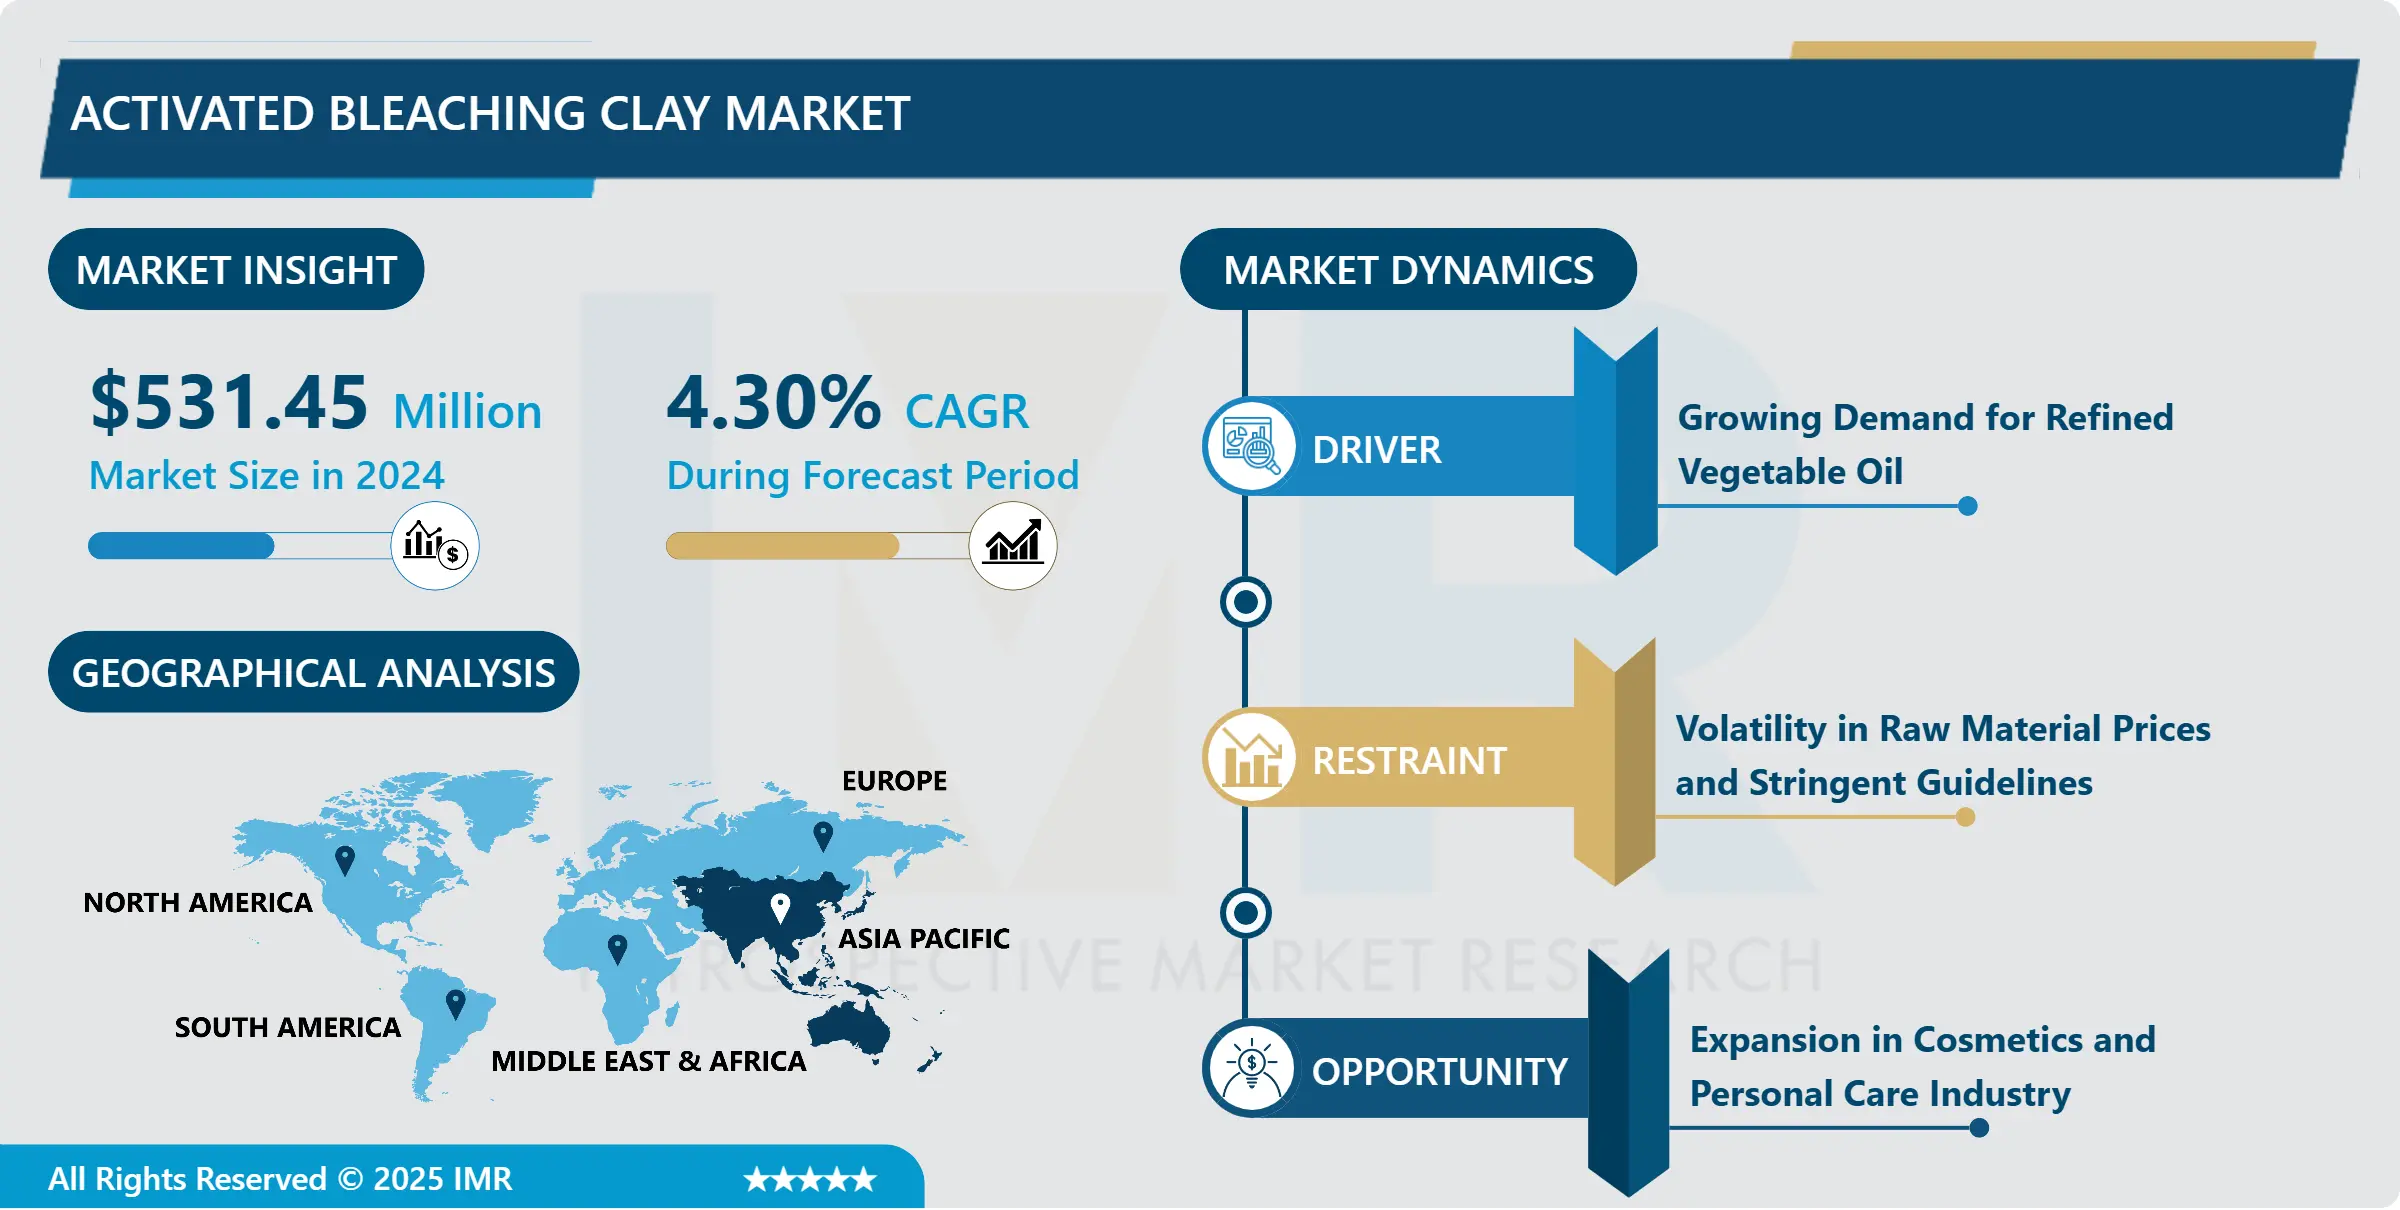
Activated Bleaching Clay Market Size Was Valued at USD 531.45 Million in 2024, and is Projected to Reach USD 844.48 Million by 2035, Growing at a CAGR of 4.30% From 2025-2035.
Activated bleaching clay is an adsorbent material used in various industries, including oil refining, cosmetics, and wastewater treatment. It is activated through processes like acid treatment or thermal activation to enhance its adsorption properties, removing impurities and color pigments from oils, waxes, and other substances, thus improving product quality and purity.
Activated bleaching clay finds widespread application across diverse industries due to its exceptional adsorption properties and purification capabilities. In the oil refining sector, it is used extensively to remove impurities and color pigments from edible oils, vegetable oils, mineral oils, and waxes. This application ensures that the final products meet stringent quality standards, enhancing their marketability and consumer acceptance. Additionally, activated bleaching clay plays a crucial role in the cosmetics and personal care industry, where it is utilized to purify and clarify skincare products, improving their efficacy and appearance.
Bleaching clay stems from its ability to effectively adsorb contaminants, including free fatty acids, pigments, and unwanted odors, resulting in cleaner and more refined end products. Furthermore, its cost-effectiveness and ease of use make it a preferred choice for industries seeking efficient purification solutions. The future demand growth for activated bleaching clay is expected to remain robust, driven by increasing industrialization, urbanization, and consumer demand for high-quality and pure products. As industries continue to prioritize product quality and purity, the demand for activated bleaching clay as a purification agent is anticipated to grow across various sectors.
Advancements in manufacturing techniques and the development of eco-friendly formulations are likely to further propel the market growth of activated bleaching clay. The exploration of new applications beyond traditional sectors, such as pharmaceuticals and environmental remediation, also presents growth opportunities for the activated bleaching clay market, fostering innovation and market expansion.

Activated Bleaching Clay Market Trend Analysis
Growing Demand for Refined Vegetable Oil
- The growing demand for refined vegetable oil stands out as a major driver fueling the growth of the activated bleaching clay market. This demand surge is propelled by various factors, including changing dietary preferences, health consciousness among consumers, and the widespread use of vegetable oils in food preparation and cooking. Refined vegetable oil is favored for its neutral flavor, high smoke point, and versatility in culinary applications, making it a staple ingredient in households, restaurants, and food processing industries.
- Activated bleaching clay plays a pivotal role in the production of refined vegetable oil by removing impurities, color pigments, and undesirable odors. This purification process enhances the quality, appearance, and shelf life of vegetable oils, meeting industry standards and consumer expectations for premium-grade products. As the demand for refined vegetable oil continues to rise, especially in emerging markets with growing populations and rising disposable incomes, the market for activated bleaching clay experiences a corresponding increase in demand.
- In oil refining technologies, coupled with the emphasis on product quality and food safety, drive the adoption of activated bleaching clay as an essential purification agent in the vegetable oil industry. Market players are also exploring innovative formulations and eco-friendly solutions to meet evolving customer preferences and regulatory requirements, further contributing to the growth and sustainability of the activated bleaching clay market amidst the expanding demand for refined vegetable oil.
Expansion in Cosmetics and Personal Care Industry
- The expansion in the cosmetics and personal care industry presents a significant opportunity for the growth of the activated bleaching clay market. This growth is driven by several factors, including increasing consumer awareness of skincare and beauty products, rising disposable incomes, and a growing emphasis on natural and organic ingredients in cosmetic formulations. Activated bleaching clay is valued in the cosmetics industry for its ability to absorb impurities, toxins, and excess oils from the skin, making it a popular ingredient in facial masks, cleansers, and exfoliating products.
- The demand for activated bleaching clay in the cosmetics and personal care sector is propelled by its versatility and effectiveness in enhancing product quality and performance. It is used to improve product texture, stability, and appearance, contributing to the overall efficacy and appeal of skincare and beauty formulations. As consumers prioritize products that offer visible results and meet their skincare needs, the demand for activated bleaching clay as a cosmetic ingredient continues to grow.
- Moreover, the growing trend towards natural and sustainable beauty solutions creates opportunities for activated bleaching clay manufacturers to develop eco-friendly and cruelty-free formulations. Collaborations between cosmetic companies and clay suppliers drive innovation in product development, leading to the introduction of new skincare and beauty products that incorporate activated bleaching clay for its purification and detoxification benefits. As the cosmetics and personal care industry expands globally, particularly in emerging markets, the demand for activated bleaching clay is expected to witness substantial growth.
Activated Bleaching Clay Market Segment Analysis:
Activated Bleaching Clay Market Segmented on the basis of Type, Application, and End-User.
By Type, Natural Bleaching Clay segment is expected to dominate the market with around 38.40% share during the forecast period.
- The natural bleaching clay segment is poised to dominate the growth of the activated bleaching clay market due to several key factors. Natural bleaching clay, derived from mineral deposits and known for its purity and effectiveness, is increasingly preferred by industries such as oil refining, cosmetics, and pharmaceuticals. It's natural composition and gentle purification properties make it a sought-after choice for applications where product quality and safety are paramount.
- Furthermore, the rising demand for natural and sustainable ingredients across various industries contributes to the dominance of the natural bleaching clay segment. Consumers and manufacturers alike are shifting towards eco-friendly and ethically sourced materials, driving the adoption of natural bleaching clay in product formulations. As regulatory bodies also encourage the use of natural ingredients in food, cosmetics, and pharmaceuticals, the natural bleaching clay segment experiences heightened demand and market growth, positioning it as a leading contributor to the overall activated bleaching clay market.
By Application, Edible Oils & Fats Refining segment is likely to command almost 31.20% share during the upcoming years.
- The edible oils & fats refining segment has emerged as the leader, holding the largest share in driving the growth of the activated bleaching clay market. This dominance is attributed to the indispensable role of activated bleaching clay in refining edible oils and fats. Activated bleaching clay's exceptional adsorption properties enable it to efficiently remove impurities, color pigments, and undesirable odors from oils and fats, resulting in high-quality refined products that meet industry standards and consumer preferences.
- Moreover, the increasing demand for refined edible oils and fats, driven by factors such as changing dietary habits, health consciousness, and culinary preferences, contributes significantly to the prominence of the edible oils & fats refining segment in the activated bleaching clay market. The use of activated bleaching clay ensures that refined oils and fats have improved clarity, stability, and flavor, making them suitable for a wide range of food applications. As the consumption of refined edible oils continues to rise globally, particularly in emerging markets with growing populations and urbanization, the demand for activated bleaching clay in the edible oils & fats refining segment is expected to maintain its leading position in the market.
Activated Bleaching Clay Market Regional Insights:
By Region, Asia Pacific region is expected to continue leading the market, capturing nearly 30.24% of the overall share during the upcoming years.
- The Asia Pacific region is anticipated to dominate the growth of the activated bleaching clay market due to several key factors. With a rapidly growing population and expanding industrial sectors, countries in the Asia Pacific region, such as China, India, and Indonesia, have witnessed a significant increase in demand for activated bleaching clay across various applications. The food and beverage industry, particularly the edible oils and fats segment, is a major driver of market growth in this region, as activated bleaching clay is essential for refining oils and fats to meet quality standards and consumer preferences.
- Furthermore, the cosmetics and personal care industry in the Asia Pacific presents substantial growth opportunities for activated bleaching clay manufacturers. The region's growing middle-class population, rising disposable incomes, and changing consumer lifestyles contribute to the increased demand for skincare, haircare, and beauty products that incorporate activated bleaching clay for their purification and detoxification properties. As the Asia Pacific region continues to experience economic development, urbanization, and industrialization, the demand for activated bleaching clay is expected to surge, solidifying its dominance in the global market.
Activated Bleaching Clay Market Top Key Players:
- Oil-Dri Corporation of America (U.S.)
- EP Minerals (U.S.)
- Mineral Technologies Inc. (U.S,)
- BASF SE (Germany)
- Merck KGaA (Germany)
- Clariant (Switzerland)
- Akzo Nobel N.V.(Netherland)
- S&B Industrial Minerals S.A. (Greece)
- Ashapura Group (India)
- HRP Industries (India)
- Korvi Activated Earth (India)
- Refoil Earth Pvt Ltd (India)
- 20 Microns Nano Minerals Ltd. (India)
- Musim Mas (Singapore)
- Dechengwang Technology Co., Ltd (China)
- The W Clay Industries Sdn. Bhd (Malaysia)
- Taiko Group (Malaysia), and Other Major Players
Key Industry Developments Activated Bleaching Clay Market
- ln May 2024, Oil-Dri Corporation of America (NYSE: ODC) completed its acquisition of Ultra Pet Company, Inc. for $46 million, solidifying its position in the cat litter industry. The strategic move aimed to expand Oil-Dri’s presence in the crystal cat litter segment. With the integration of Ultra Pet’s expertise, both companies worked towards blending cultures and optimizing operations. The acquisition was financed through a combination of cash and existing credit facilities.
- In May 29, 2024, Ashapura Minechem Ltd. (Ashapura Perfoclay Ltd.) published its Annual Report 2023–24, disclosing operational investments in its bleaching-clay business including detailed effluent-treatment (neutralization → RO → MEE → reuse) to achieve near zero liquid discharge and sustain plant operations.
(Source: https://www.ashapura.com/)
|
Global Activated Bleaching Clay Market |
|||
|
Base Year: |
2024 |
Forecast Period: |
2025-2035 |
|
Historical Data: |
2018 to 2023 |
Market Size in 2024 : |
USD 531.45 Mn. |
|
Forecast Period 2025-35 CAGR: |
4.30% |
Market Size in 2035 : |
USD 844.48 Mn. |
|
Segments Covered: |
By Type |
|
|
|
By Application |
|
||
|
By End-User |
|
||
|
By Region |
|
||
|
Key Market Drivers: |
|
||
|
Key Market Restraints: |
|
||
|
Key Opportunities: |
|
||
|
Companies Covered in the report: |
|
||
Chapter 1: Introduction
1.1 Scope and Coverage
Chapter 2:Executive Summary
Chapter 3: Market Landscape
3.1 Market Dynamics
3.1.1 Drivers
3.1.2 Restraints
3.1.3 Opportunities
3.1.4 Challenges
3.2 Market Trend Analysis
3.3 PESTLE Analysis
3.4 Porter's Five Forces Analysis
3.5 Industry Value Chain Analysis
3.6 Ecosystem
3.7 Regulatory Landscape
3.8 Price Trend Analysis
3.9 Patent Analysis
3.10 Technology Evolution
3.11 Investment Pockets
3.12 Import-Export Analysis
Chapter 4: Activated Bleaching Clay Market by Type (2018-2032)
4.1 Activated Bleaching Clay Market Snapshot and Growth Engine
4.2 Market Overview
4.3 Natural Bleaching Clay
4.3.1 Introduction and Market Overview
4.3.2 Historic and Forecasted Market Size in Value USD and Volume Units
4.3.3 Key Market Trends, Growth Factors, and Opportunities
4.3.4 Geographic Segmentation Analysis
4.4 Acid-Activated Bleaching Clay
4.5 Bentonite Clay
Chapter 5: Activated Bleaching Clay Market by Application (2018-2032)
5.1 Activated Bleaching Clay Market Snapshot and Growth Engine
5.2 Market Overview
5.3 Edible Oils & Fats Refining
5.3.1 Introduction and Market Overview
5.3.2 Historic and Forecasted Market Size in Value USD and Volume Units
5.3.3 Key Market Trends, Growth Factors, and Opportunities
5.3.4 Geographic Segmentation Analysis
5.4 Mineral Oil & Waxes
5.5 Vegetable Oils Refining
5.6 Wax Refining
Chapter 6: Activated Bleaching Clay Market by End-User (2018-2032)
6.1 Activated Bleaching Clay Market Snapshot and Growth Engine
6.2 Market Overview
6.3 Food & Beverage
6.3.1 Introduction and Market Overview
6.3.2 Historic and Forecasted Market Size in Value USD and Volume Units
6.3.3 Key Market Trends, Growth Factors, and Opportunities
6.3.4 Geographic Segmentation Analysis
6.4 Cosmetics & Personal Care
6.5 Chemicals
Chapter 7: Company Profiles and Competitive Analysis
7.1 Competitive Landscape
7.1.1 Competitive Benchmarking
7.1.2 Activated Bleaching Clay Market Share by Manufacturer (2024)
7.1.3 Industry BCG Matrix
7.1.4 Heat Map Analysis
7.1.5 Mergers and Acquisitions
7.2 OLYMPUS (JAPAN)
7.2.1 Company Overview
7.2.2 Key Executives
7.2.3 Company Snapshot
7.2.4 Role of the Company in the Market
7.2.5 Sustainability and Social Responsibility
7.2.6 Operating Business Segments
7.2.7 Product Portfolio
7.2.8 Business Performance
7.2.9 Key Strategic Moves and Recent Developments
7.2.10 SWOT Analysis
7.3 KARL STORZ (GERMANY)
7.4 FUJIFILM (JAPAN)
7.5 ENDOMED (USA)
7.6 HUGER ENDOSCOPY INSTRUMENTS (USA)
7.7 SONOSCAPE (CHINA)
7.8 ENDOCHOICE (USA)
7.9 ANA-MED (USA)
7.10 PENTAX MEDICAL (JAPAN)
7.11 B. BRAUN (GERMANY)
7.12 MEDTRONIC XOMED INC. (USA)
7.13 STRYKER (USA)
7.14 COOK (USA)
7.15 RICHARD WOLF GMBH (GERMANY)
7.16 HENKE-SASS WOLF GMBH (GERMANY)
7.17 XION GMBH (GERMANY)
7.18 BOSTON SCIENTIFIC (USA)
7.19 ENDO OPTIKS INC. (USA)
7.20 POLYDIAGNOST (GERMANY)
7.21 HOYA (JAPAN)
7.22 ARTHREX (USA)
7.23 WELCH ALLYN (USA)
7.24 OTTOMED ENDOSCOPY (INDIA)
7.25 AMBU (DENMARK)
7.26 MINDRAY (CHINA)
7.27 AND
Chapter 8: Global Activated Bleaching Clay Market By Region
8.1 Overview
8.2. North America Activated Bleaching Clay Market
8.2.1 Key Market Trends, Growth Factors and Opportunities
8.2.2 Top Key Companies
8.2.3 Historic and Forecasted Market Size by Segments
8.2.4 Historic and Forecasted Market Size by Type
8.2.4.1 Natural Bleaching Clay
8.2.4.2 Acid-Activated Bleaching Clay
8.2.4.3 Bentonite Clay
8.2.5 Historic and Forecasted Market Size by Application
8.2.5.1 Edible Oils & Fats Refining
8.2.5.2 Mineral Oil & Waxes
8.2.5.3 Vegetable Oils Refining
8.2.5.4 Wax Refining
8.2.6 Historic and Forecasted Market Size by End-User
8.2.6.1 Food & Beverage
8.2.6.2 Cosmetics & Personal Care
8.2.6.3 Chemicals
8.2.7 Historic and Forecast Market Size by Country
8.2.7.1 US
8.2.7.2 Canada
8.2.7.3 Mexico
8.3. Eastern Europe Activated Bleaching Clay Market
8.3.1 Key Market Trends, Growth Factors and Opportunities
8.3.2 Top Key Companies
8.3.3 Historic and Forecasted Market Size by Segments
8.3.4 Historic and Forecasted Market Size by Type
8.3.4.1 Natural Bleaching Clay
8.3.4.2 Acid-Activated Bleaching Clay
8.3.4.3 Bentonite Clay
8.3.5 Historic and Forecasted Market Size by Application
8.3.5.1 Edible Oils & Fats Refining
8.3.5.2 Mineral Oil & Waxes
8.3.5.3 Vegetable Oils Refining
8.3.5.4 Wax Refining
8.3.6 Historic and Forecasted Market Size by End-User
8.3.6.1 Food & Beverage
8.3.6.2 Cosmetics & Personal Care
8.3.6.3 Chemicals
8.3.7 Historic and Forecast Market Size by Country
8.3.7.1 Russia
8.3.7.2 Bulgaria
8.3.7.3 The Czech Republic
8.3.7.4 Hungary
8.3.7.5 Poland
8.3.7.6 Romania
8.3.7.7 Rest of Eastern Europe
8.4. Western Europe Activated Bleaching Clay Market
8.4.1 Key Market Trends, Growth Factors and Opportunities
8.4.2 Top Key Companies
8.4.3 Historic and Forecasted Market Size by Segments
8.4.4 Historic and Forecasted Market Size by Type
8.4.4.1 Natural Bleaching Clay
8.4.4.2 Acid-Activated Bleaching Clay
8.4.4.3 Bentonite Clay
8.4.5 Historic and Forecasted Market Size by Application
8.4.5.1 Edible Oils & Fats Refining
8.4.5.2 Mineral Oil & Waxes
8.4.5.3 Vegetable Oils Refining
8.4.5.4 Wax Refining
8.4.6 Historic and Forecasted Market Size by End-User
8.4.6.1 Food & Beverage
8.4.6.2 Cosmetics & Personal Care
8.4.6.3 Chemicals
8.4.7 Historic and Forecast Market Size by Country
8.4.7.1 Germany
8.4.7.2 UK
8.4.7.3 France
8.4.7.4 The Netherlands
8.4.7.5 Italy
8.4.7.6 Spain
8.4.7.7 Rest of Western Europe
8.5. Asia Pacific Activated Bleaching Clay Market
8.5.1 Key Market Trends, Growth Factors and Opportunities
8.5.2 Top Key Companies
8.5.3 Historic and Forecasted Market Size by Segments
8.5.4 Historic and Forecasted Market Size by Type
8.5.4.1 Natural Bleaching Clay
8.5.4.2 Acid-Activated Bleaching Clay
8.5.4.3 Bentonite Clay
8.5.5 Historic and Forecasted Market Size by Application
8.5.5.1 Edible Oils & Fats Refining
8.5.5.2 Mineral Oil & Waxes
8.5.5.3 Vegetable Oils Refining
8.5.5.4 Wax Refining
8.5.6 Historic and Forecasted Market Size by End-User
8.5.6.1 Food & Beverage
8.5.6.2 Cosmetics & Personal Care
8.5.6.3 Chemicals
8.5.7 Historic and Forecast Market Size by Country
8.5.7.1 China
8.5.7.2 India
8.5.7.3 Japan
8.5.7.4 South Korea
8.5.7.5 Malaysia
8.5.7.6 Thailand
8.5.7.7 Vietnam
8.5.7.8 The Philippines
8.5.7.9 Australia
8.5.7.10 New Zealand
8.5.7.11 Rest of APAC
8.6. Middle East & Africa Activated Bleaching Clay Market
8.6.1 Key Market Trends, Growth Factors and Opportunities
8.6.2 Top Key Companies
8.6.3 Historic and Forecasted Market Size by Segments
8.6.4 Historic and Forecasted Market Size by Type
8.6.4.1 Natural Bleaching Clay
8.6.4.2 Acid-Activated Bleaching Clay
8.6.4.3 Bentonite Clay
8.6.5 Historic and Forecasted Market Size by Application
8.6.5.1 Edible Oils & Fats Refining
8.6.5.2 Mineral Oil & Waxes
8.6.5.3 Vegetable Oils Refining
8.6.5.4 Wax Refining
8.6.6 Historic and Forecasted Market Size by End-User
8.6.6.1 Food & Beverage
8.6.6.2 Cosmetics & Personal Care
8.6.6.3 Chemicals
8.6.7 Historic and Forecast Market Size by Country
8.6.7.1 Turkiye
8.6.7.2 Bahrain
8.6.7.3 Kuwait
8.6.7.4 Saudi Arabia
8.6.7.5 Qatar
8.6.7.6 UAE
8.6.7.7 Israel
8.6.7.8 South Africa
8.7. South America Activated Bleaching Clay Market
8.7.1 Key Market Trends, Growth Factors and Opportunities
8.7.2 Top Key Companies
8.7.3 Historic and Forecasted Market Size by Segments
8.7.4 Historic and Forecasted Market Size by Type
8.7.4.1 Natural Bleaching Clay
8.7.4.2 Acid-Activated Bleaching Clay
8.7.4.3 Bentonite Clay
8.7.5 Historic and Forecasted Market Size by Application
8.7.5.1 Edible Oils & Fats Refining
8.7.5.2 Mineral Oil & Waxes
8.7.5.3 Vegetable Oils Refining
8.7.5.4 Wax Refining
8.7.6 Historic and Forecasted Market Size by End-User
8.7.6.1 Food & Beverage
8.7.6.2 Cosmetics & Personal Care
8.7.6.3 Chemicals
8.7.7 Historic and Forecast Market Size by Country
8.7.7.1 Brazil
8.7.7.2 Argentina
8.7.7.3 Rest of SA
Chapter 9 Analyst Viewpoint and Conclusion
9.1 Recommendations and Concluding Analysis
9.2 Potential Market Strategies
Chapter 10 Research Methodology
10.1 Research Process
10.2 Primary Research
10.3 Secondary Research
|
Global Activated Bleaching Clay Market |
|||
|
Base Year: |
2024 |
Forecast Period: |
2025-2035 |
|
Historical Data: |
2018 to 2023 |
Market Size in 2024 : |
USD 531.45 Mn. |
|
Forecast Period 2025-35 CAGR: |
4.30% |
Market Size in 2035 : |
USD 844.48 Mn. |
|
Segments Covered: |
By Type |
|
|
|
By Application |
|
||
|
By End-User |
|
||
|
By Region |
|
||
|
Key Market Drivers: |
|
||
|
Key Market Restraints: |
|
||
|
Key Opportunities: |
|
||
|
Companies Covered in the report: |
|
||


