


3D Rendering and Visualization Software Market Synopsis
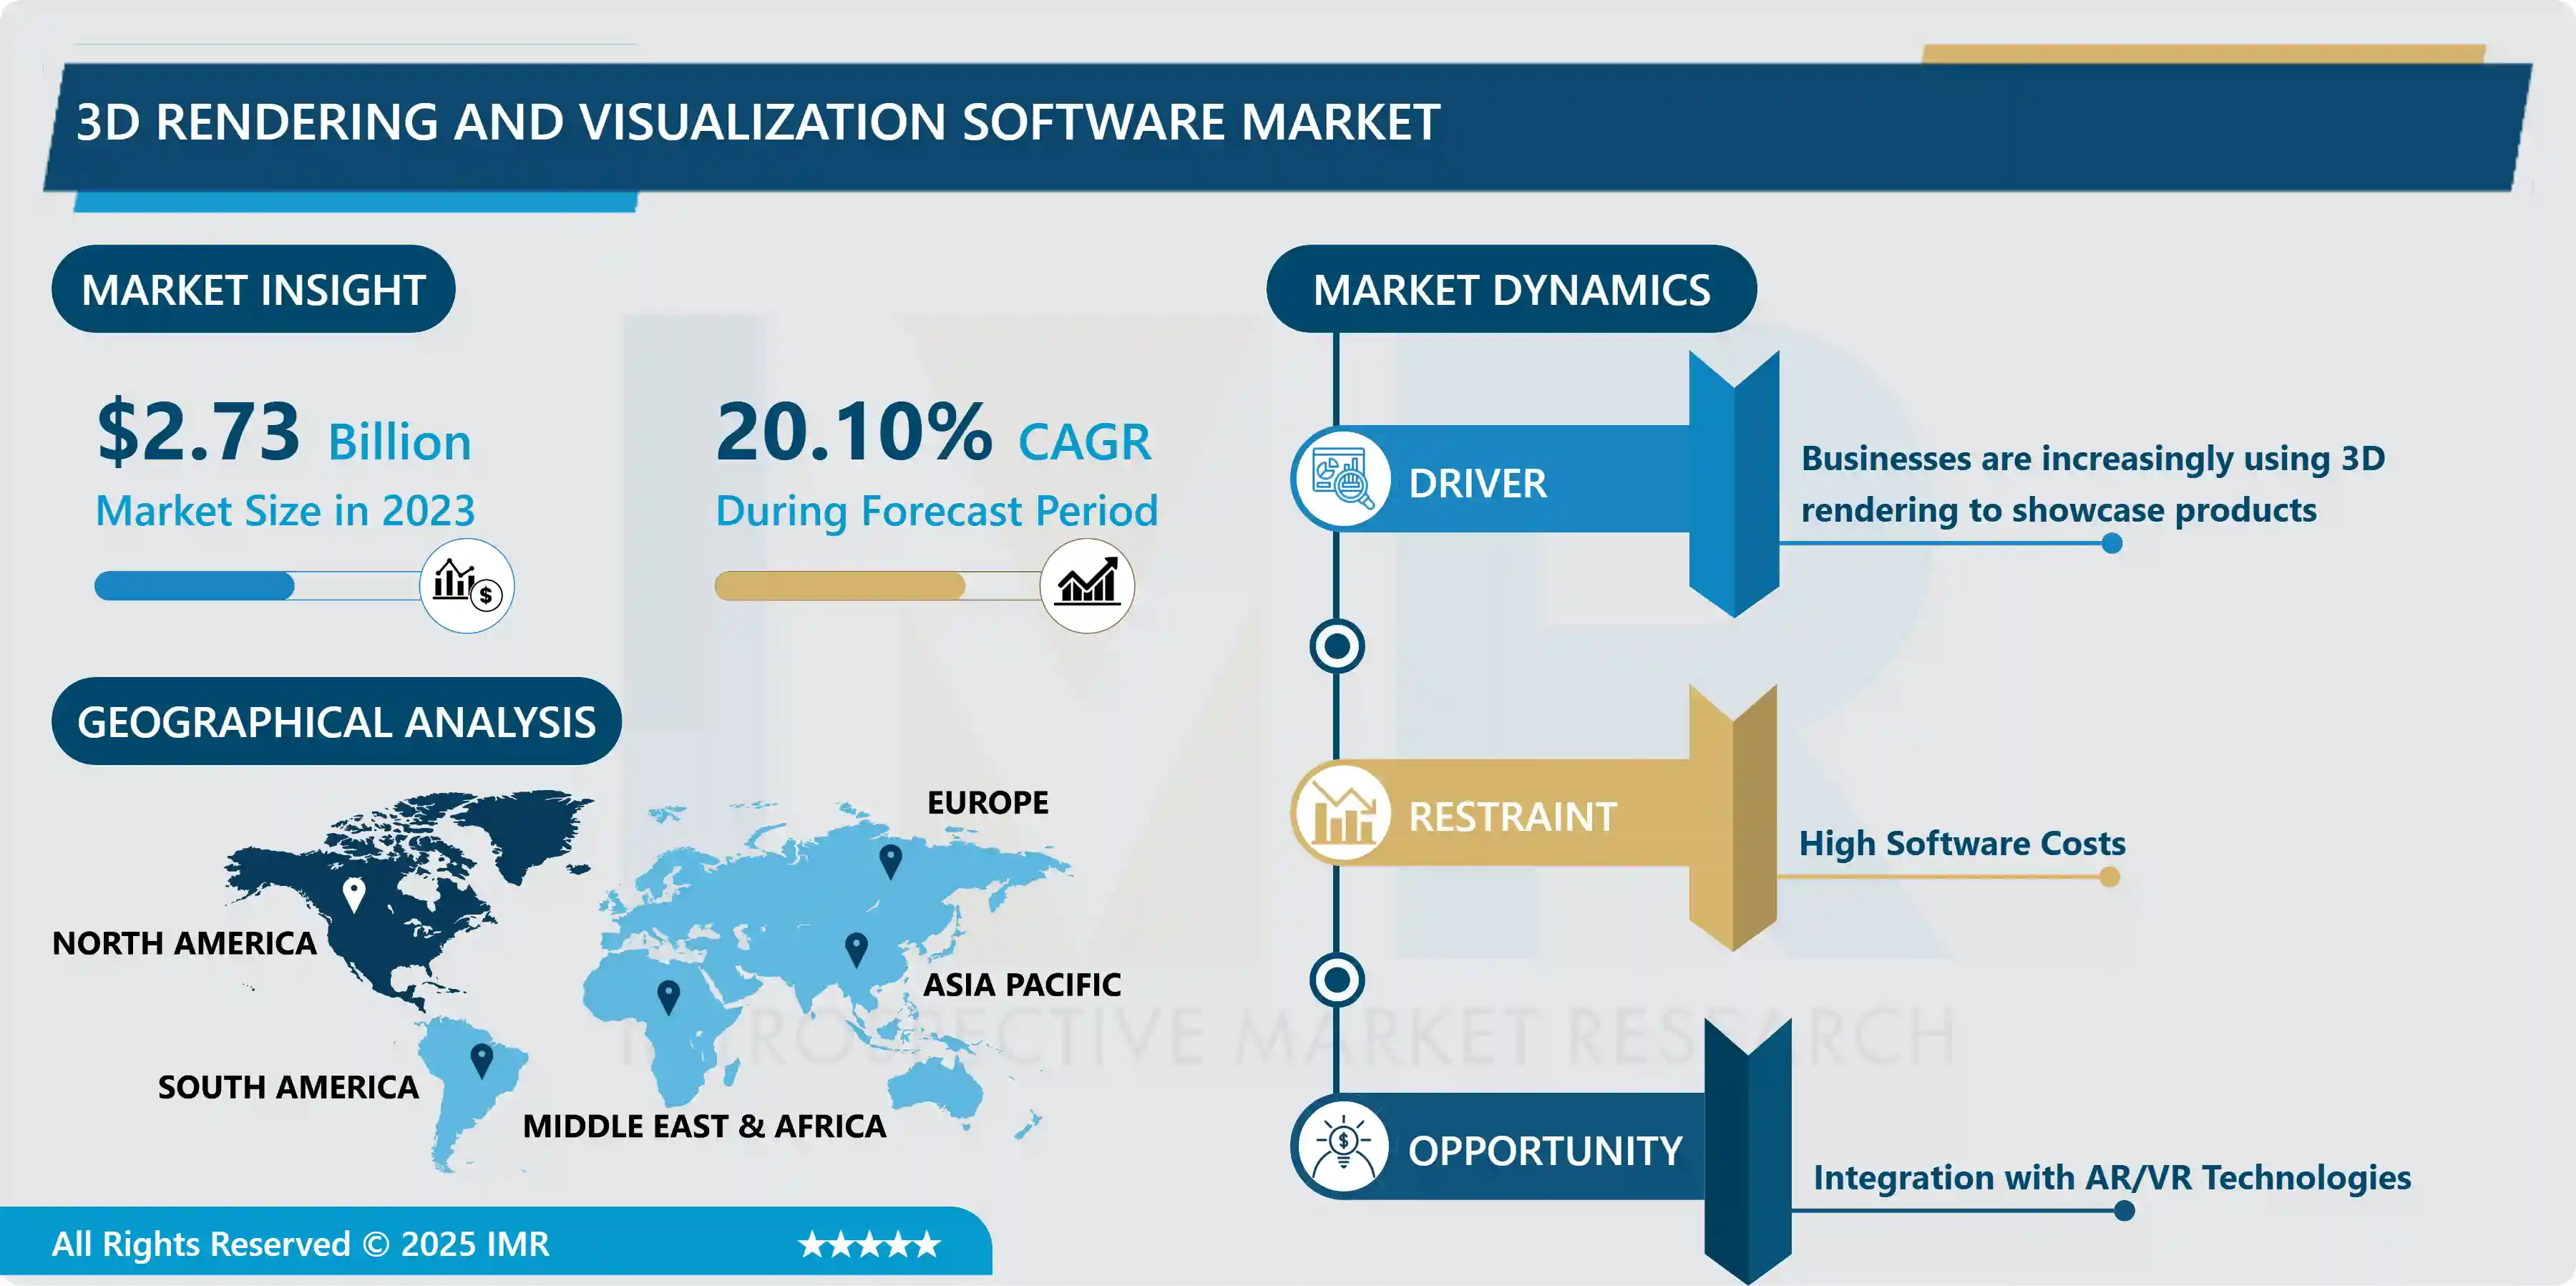
3D Rendering and Visualization Software Market Size Was Valued at USD 2.73 Billion in 2023 and is Projected to Reach USD 14.17 Billion by 2032, Growing at a CAGR of 6.3 % From 2024-2032.
3D rendering software and visualization software are applications that can be installed on a computer to create an illusion of three-dimensional objects or animations using a model of the object or person. Such technologies are used in different industries such as architecture, graphics design, film and game production, product creation, and the creative process. 3D modeling and rendering software makes use of sophisticated algorithms and techniques to replicate shading and shadows and then apply reflections for a real-looking image.
Specialists can depict their designs in 3D computer visualization technology for customers in the domains of architecture and interior design with photorealistic results. This helps architects visualize structures and locations before constructing starts and allows them to make informed decisions thereby ensuring streamlining the decision-making and communication process.
Unlike in the real world, rendering software in the game industry today is used to create engaging and lifelike virtual worlds. There, players can interact and explore the surroundings while they also interact with characters which too are rendered as virtual. The most important element in filmmaking is the rendering software which makes the possible appearance of special effects, CGI proceeding, and virtual scenes that are indistinguishable from actual shooting.
Besides, there are a great number of varieties of 3D rendering and visualisation software that gives their users a wide choice of features to be used for fine-tuning and setting up the needed visual parameters to obtain the desired effects. In addition to using different level of lights and camera angles to add accuracy or contrast, they offer a variety of textures and materials which serve for the purpose of creativity and better visuals.
Finally, other 3D rendering software programs integrate with different design tools and production pipelines, thus providing convenient import, change, and export options of 3D models in between working environments. Finally, it can be summarized that the technologies of 3D rendering and visualization are leading the way we create, communicate and have a feel of the virtual worlds in different aspects of life.

3D Rendering and Visualization Software Market Trend Analysis
Rising Demand for Immersive Content
- The increasing need for consuming individuals to have immersive experience is a key factor impelling the increase of the revenue of this industry. Increasingly, corporations understand the bottom-line appeal of interactivity and the spectrum from virtual reality (VR) to augmented reality (AR). As more consumers demand the realism of visual fidelity, the demand for providing better visual experiences grows.
- People are now growing more and more determined to see content in various forms for say architecture tours, gaming worlds, or virtual product demonstrations. 3D rendering and visualization technologies cannot be understated in achieving these expectant, since they show the illusion of reality through simulation and environment to let the users be involved in the virtual world.
- While pushing the limits of technology the challenges for creating such immersive entertainment decline. It’s these factors, right? accessibility of 3D modeling tools, strong software processors' and software algorithms that whay the popularity of 3D printing grow.
- Hence, subjects and organizations of different field of industries keenly establish the idea of immersive content to build the interaction of customers, training programs and marketing. The evolution of 3D rendering and visualization software will continue to experience the growing equipments responsible for attracting new customers and building loyal market.
Growth of the Metaverse
- The Metaverse impressively fast growing space creates a significant room for the market of the 3D rendering and visualisation software. The Metaverse is a common virtual shared space developed by the fusion of many physical realities that are supported by the improved virtual world, augmented reality, and the Internet.
- Although the supposedness of the idea and companies make more investments towards creating virtual worlds, the prospects of the demand for up-market 3D rendering and visualization technologies are estimated to grow. Such devices are very important in realizing stunning virtual surroundings, attractive characters of avatars, and diverse web platforms which navigate intuitively.
- Metaverse, a virtual place, does an array of interaction possibilities in the real world; for instance, virtual meetings, e-commerce, education, and entertainment have been included. Softwares that can allow businesses for marking their presence in this virtual world will need to build up their capability of 3D rendering and visualization tools to make sure that their ideas come to life.
- Therefore, software developers are bound to innovate, develop new products and opportunities to specifications in order to meet the Metaverse requirements which will further drive the growth of the market. In another way the Metaverse is just a new level of obtaining digital comradeship and commerce and 3D rendering and visualization techniques will be one of the major supporters of such world transformation.
3D Rendering and Visualization Software Market Segment Analysis:
3D Rendering and Visualization Software Market Segmented based on Deployment, Applications and Industry.
By Deployment, 2-Bay segment is expected to dominate the market during the forecast period
- As a matter of fact, the use of cloud deployment rather dominates, in the last few years, the market of 3D Rendering and Visualization software. The cloud-based solutions being used nowadays to replace on premises deployments are causing a lot of companies especially SMEs to sign up to that particular service, and this is the reason why their adopts have generally spiked.
- On the other hand, cloud-based rendering and visualization software is scalable and flexible and it can be switched on/off if the user needs more power. The user can choose a specific project features to increase his capabilities. This scalability is particularly needed in the sector subjected to workload fluctuations or periods of high demand, since it enables faster adjustment of their rendering capacity without any additional hardware infrastructure investments.
- this opportunity is accessed through the use of cloud-based solutions which in turn promotes collaboration and cooperation. The data being stored in cloud computing, makes it possible for geographically distant teams to work collaboratively in real time on 3D projects, having access to and changing documents and materials any time while the internet connection is on.
- Thanks to this level of partnership planning would be faster and communication with other stakeholders would be improved because they have the ability to review and provide input on renderings without going through additional file sharing processes. Additionally, cloud computing and its related rendering systems allow a lot of cloud-based tools and programs to communicate, which comes down to the simplification of workflows or improving interoperability of a large number of related resources.
- The fact that the cloud deployment is currently leading the way in the field of 3D rendering and visualization software can be ascribed to its usability, flexibility, and communication capabilities. All of which highly catered to the dynamic and connected modern world.
- Meanwhile, many businesses, especially those with special security or regulatory requirements would still prefer on-premise option to render their animations. However, the ease and fast delivery of cloud based rendering solutions make it win the hearts of many other customers that in the end cloud based rendering solutions are still dominating the market space.
By End Use, Small and Medium-sized Businesses (SMBs) segment held the largest share
- Among the engaging spaces in the realm of 3D rendering and graphic software, it is the realm of product design and modeling applications that is outstanding. This dominance can be observed from the fact that 3D Rendering is not only the critical part in product development cycle of a lot of industries including automotive, manufacturing, consumer products, and industrial design, but also the most important characteristic of these industries.
- Each and every 3D model created by product designers and engineers, almost always use 3D rendering and modeling technologies in order to simulate complex models and study product functionality before commencing production. This is one of the most noticeable benefits of these tools. They eliminate the need for long trial and error design processes to iterate ideas and significantly reduce the time and cost usually associated with physical prototyping purely for testing and validation purposes.
- As a consequence, the technical aspect of the production has become more complicated, and the required customization of the manufacturing do not turn keeping the pace with the development of the 3D rendering and modeling technologies for product design and modeling. These rendering engines with advanced features like parametric modeling, real-time rendering, and virtual reality are the contributing factors to allowing designers to do creative things, move ideas into virtual testing, and showcase their designs with a high mimicry.
- In addition, with businesses opting for digital transformation and the resulting implementation of novel technologies like additive manufacturing and digital twins, an increased necessity for 3D rendering tools that are highly sophisticated and target product design and modeling applications is expected.
- Even though applications such as 3D modelling, animations, and simulations are mandatory in various fields such as entertainment, training, as well as architectural fields, this segment moves to the first place of 3D rendering & visualization software market because of the importance of 3D modelling and design.
3D Rendering and Visualization Software Market Regional Insights:
North America is Expected to Dominate the Market Over the Forecast period
- There are several reasons which push the application of 3D rendering and visualization software to the North American market which leads to its dominance. Primarily, the region hosts some of the world`s prominent technology firms and programmers who are focused on 3D image creation and visualization. North America is the home site of the giants among the industry like Autodesk, NVIDIA, Adobe, and Unity, and thus, carrying abundant experts and resources to enhance the development of 3D rendering industry there.
- 3D rendering is heavily used by various industries in which it is very crucial, such as entertainment, gaming, architecture, engineering and manufacturing and businesses in the North American region have a significant share in these sectors. Hollywood in thw US which is the epicenter of thw world film industry and highly relies of cutting-edge speciaal effects and animation technologies.
- In a similar manner, being an opinion leader, Silicon Valley is able to concentrate and direct technological innovations such that computer-generated imaging companies and other businesses in related areas compete and collaborate.
- Northern America has a robust structure that supports digital technologies, a dynamic startup system and a diverse economy/workforce, all of which enable its superiority when it comes to 3D rendering and visualization software. Accessibility to next-generation broadband networks, potent computation apparatus, skillful researchers, and R&D facilities enhance North America's authority in this sector.
- The living environment, shaped by the ever-evolving business domain and inclusion of the entrepreneurship spirit, facilitates the emergence of startups and innovators who become the drivers of new technology developments and the ones that bring most of the technological breakthroughs in the 3D rendering and visualization markets.
Active Key Players in the 3D Rendering and Visualization Software Market
- AUTODESK, INC. (UNITED STATES)
- DASSAULT SYSTÈMES SE (FRANCE)
- NVIDIA CORPORATION (UNITED STATES)
- ADOBE INC. (UNITED STATES)
- CHAOS GROUP (BULGARIA)
- TRIMBLE INC. (UNITED STATES)
- LUXION, INC. (UNITED STATES)
- NEXT LIMIT TECHNOLOGIES (SPAIN)
- OTOY INC. (UNITED STATES)
- BLENDER FOUNDATION (NETHERLANDS)
- MAXON COMPUTER GMBH (GERMANY)
- PIXAR ANIMATION STUDIOS (UNITED STATES)
- FOUNDRY (UNITED KINGDOM)
- UNITY TECHNOLOGIES (UNITED STATES)
- WETA DIGITAL (NEW ZEALAND)
- SOLID ANGLE (SPAIN)
- COREL CORPORATION (CANADA)
- KEYSHOT (UNITED STATES)
- THE FOUNDRY VISIONMONGERS LTD. (UNITED KINGDOM)
- ACT-3D B.V. (NETHERLANDS)
- SIDEFX (CANADA)
- ENSCAPE GMBH (GERMANY)
- REDSHIFT RENDERING TECHNOLOGIES INC. (UNITED STATES)
- BENTLEY SYSTEMS, INCORPORATED (UNITED STATES)
- RENDER LEGION S.R.O. (CZECH REPUBLIC)
- VRAY.INFO (BULGARIA)
- ISOTROPIX (FRANCE)
- LIGHTMAP LTD. (UNITED KINGDOM)
- E-ON SOFTWARE (FRANCE)
- OTHER KEY PLAYERS
Key Industry Developments in the 3D Rendering and Visualization Software Market:
- In December 2023, Tech Soft 3D has launched HOOPS Luminate, a new SDK for photo-realistic and real-time rendering. This toolkit offers advanced materials and extensive rendering control, enabling developers to create visually stunning 3D applications. The integration with HOOPS Visualize combines engineering-focused graphics with high-quality renderings. Product Manager Marco Salino highlights the state-of-the-art speed, quality, and realism achieved with this SDK.
- In August 2023, The Khronos Group announces the launch of ANARI 1.0, the first cross-platform 3D rendering engine API, simplifying 3D visualization application development. With implementations from AMD, Intel, and NVIDIA, and an open-source SDK from Khronos, ANARI supports high-level functionality and compatibility with glTF PBR materials. It is integrated into scientific visualization tools like VMD and VTK/ParaView, enhancing access to sophisticated 3D rendering features.
|
Global 3D Rendering and Visualization Software Market |
|||
|
Base Year: |
2023 |
Forecast Period: |
2024-2032 |
|
Historical Data: |
2017 to 2023 |
Market Size in 2023: |
USD 2.73 Bn. |
|
Forecast Period 2023-34 CAGR: |
6.3% |
Market Size in 2032: |
USD 14.17 Bn. |
|
Segments Covered: |
By Deployment |
|
|
|
By Applications |
|
||
|
By Industry |
|
||
|
By Region |
|
||
|
Key Market Drivers: |
|
||
|
Key Market Restraints: |
|
||
|
Key Opportunities: |
|
||
|
Companies Covered in the report: |
|
||
Chapter 1: Introduction
1.1 Scope and Coverage
Chapter 2:Executive Summary
Chapter 3: Market Landscape
3.1 Market Dynamics
3.1.1 Drivers
3.1.2 Restraints
3.1.3 Opportunities
3.1.4 Challenges
3.2 Market Trend Analysis
3.3 PESTLE Analysis
3.4 Porter's Five Forces Analysis
3.5 Industry Value Chain Analysis
3.6 Ecosystem
3.7 Regulatory Landscape
3.8 Price Trend Analysis
3.9 Patent Analysis
3.10 Technology Evolution
3.11 Investment Pockets
3.12 Import-Export Analysis
Chapter 4: 3D Rendering and Visualization Software Market by Deployment (2018-2032)
4.1 3D Rendering and Visualization Software Market Snapshot and Growth Engine
4.2 Market Overview
4.3 On-premises
4.3.1 Introduction and Market Overview
4.3.2 Historic and Forecasted Market Size in Value USD and Volume Units
4.3.3 Key Market Trends, Growth Factors, and Opportunities
4.3.4 Geographic Segmentation Analysis
4.4 Cloud
Chapter 5: 3D Rendering and Visualization Software Market by Applications (2018-2032)
5.1 3D Rendering and Visualization Software Market Snapshot and Growth Engine
5.2 Market Overview
5.3 Consumer
5.3.1 Introduction and Market Overview
5.3.2 Historic and Forecasted Market Size in Value USD and Volume Units
5.3.3 Key Market Trends, Growth Factors, and Opportunities
5.3.4 Geographic Segmentation Analysis
5.4 Product Design and Modeling
5.5 Animation
5.6 Visualization and Simulation
5.7 Others (Marketing and Sales)
Chapter 6: 3D Rendering and Visualization Software Market by Industry (2018-2032)
6.1 3D Rendering and Visualization Software Market Snapshot and Growth Engine
6.2 Market Overview
6.3 Architecture
6.3.1 Introduction and Market Overview
6.3.2 Historic and Forecasted Market Size in Value USD and Volume Units
6.3.3 Key Market Trends, Growth Factors, and Opportunities
6.3.4 Geographic Segmentation Analysis
6.4 Engineering
6.5 and Construction
6.6 Gaming & Entertainment
6.7 Healthcare
6.8 Manufacturing & Automotive
6.9 Others (Education)
Chapter 7: Company Profiles and Competitive Analysis
7.1 Competitive Landscape
7.1.1 Competitive Benchmarking
7.1.2 3D Rendering and Visualization Software Market Share by Manufacturer (2024)
7.1.3 Industry BCG Matrix
7.1.4 Heat Map Analysis
7.1.5 Mergers and Acquisitions
7.2 AGC CHEMICALS AMERICAS (U.S.)
7.2.1 Company Overview
7.2.2 Key Executives
7.2.3 Company Snapshot
7.2.4 Role of the Company in the Market
7.2.5 Sustainability and Social Responsibility
7.2.6 Operating Business Segments
7.2.7 Product Portfolio
7.2.8 Business Performance
7.2.9 Key Strategic Moves and Recent Developments
7.2.10 SWOT Analysis
7.3 THE CHEMOURS COMPANY (U.S.)
7.4 DUPONT DE NEMOURS INC. (U.S.)
7.5 FUJIFILM HOLDINGS AMERICA CORPORATION (U.S.)
7.6 GRAVER TECHNOLOGIES (U.S.)
7.7 SYNDER FILTRATION INC. (U.S.)
7.8 THE CHEMOURS COMPANY (U.S.)
7.9 VEOLIA WATER TECHNOLOLGIES INC. (U.S.)
7.10 LANXESS (GERMANY)
7.11 DE NORA S.P.A (ITALY)
7.12 CAPLINQ CORPORATION (NETHERLANDS)
7.13 ASAHI KASEI CORPORATION (JAPAN)
7.14 SHIN-ETSU CHEMICAL COLTD. (JAPAN)
7.15 DONGYUE GROUP COLTD (CHINA)
7.16 YUANBO ENGINEERING COLTD (CHINA)
7.17
Chapter 8: Global 3D Rendering and Visualization Software Market By Region
8.1 Overview
8.2. North America 3D Rendering and Visualization Software Market
8.2.1 Key Market Trends, Growth Factors and Opportunities
8.2.2 Top Key Companies
8.2.3 Historic and Forecasted Market Size by Segments
8.2.4 Historic and Forecasted Market Size by Deployment
8.2.4.1 On-premises
8.2.4.2 Cloud
8.2.5 Historic and Forecasted Market Size by Applications
8.2.5.1 Consumer
8.2.5.2 Product Design and Modeling
8.2.5.3 Animation
8.2.5.4 Visualization and Simulation
8.2.5.5 Others (Marketing and Sales)
8.2.6 Historic and Forecasted Market Size by Industry
8.2.6.1 Architecture
8.2.6.2 Engineering
8.2.6.3 and Construction
8.2.6.4 Gaming & Entertainment
8.2.6.5 Healthcare
8.2.6.6 Manufacturing & Automotive
8.2.6.7 Others (Education)
8.2.7 Historic and Forecast Market Size by Country
8.2.7.1 US
8.2.7.2 Canada
8.2.7.3 Mexico
8.3. Eastern Europe 3D Rendering and Visualization Software Market
8.3.1 Key Market Trends, Growth Factors and Opportunities
8.3.2 Top Key Companies
8.3.3 Historic and Forecasted Market Size by Segments
8.3.4 Historic and Forecasted Market Size by Deployment
8.3.4.1 On-premises
8.3.4.2 Cloud
8.3.5 Historic and Forecasted Market Size by Applications
8.3.5.1 Consumer
8.3.5.2 Product Design and Modeling
8.3.5.3 Animation
8.3.5.4 Visualization and Simulation
8.3.5.5 Others (Marketing and Sales)
8.3.6 Historic and Forecasted Market Size by Industry
8.3.6.1 Architecture
8.3.6.2 Engineering
8.3.6.3 and Construction
8.3.6.4 Gaming & Entertainment
8.3.6.5 Healthcare
8.3.6.6 Manufacturing & Automotive
8.3.6.7 Others (Education)
8.3.7 Historic and Forecast Market Size by Country
8.3.7.1 Russia
8.3.7.2 Bulgaria
8.3.7.3 The Czech Republic
8.3.7.4 Hungary
8.3.7.5 Poland
8.3.7.6 Romania
8.3.7.7 Rest of Eastern Europe
8.4. Western Europe 3D Rendering and Visualization Software Market
8.4.1 Key Market Trends, Growth Factors and Opportunities
8.4.2 Top Key Companies
8.4.3 Historic and Forecasted Market Size by Segments
8.4.4 Historic and Forecasted Market Size by Deployment
8.4.4.1 On-premises
8.4.4.2 Cloud
8.4.5 Historic and Forecasted Market Size by Applications
8.4.5.1 Consumer
8.4.5.2 Product Design and Modeling
8.4.5.3 Animation
8.4.5.4 Visualization and Simulation
8.4.5.5 Others (Marketing and Sales)
8.4.6 Historic and Forecasted Market Size by Industry
8.4.6.1 Architecture
8.4.6.2 Engineering
8.4.6.3 and Construction
8.4.6.4 Gaming & Entertainment
8.4.6.5 Healthcare
8.4.6.6 Manufacturing & Automotive
8.4.6.7 Others (Education)
8.4.7 Historic and Forecast Market Size by Country
8.4.7.1 Germany
8.4.7.2 UK
8.4.7.3 France
8.4.7.4 The Netherlands
8.4.7.5 Italy
8.4.7.6 Spain
8.4.7.7 Rest of Western Europe
8.5. Asia Pacific 3D Rendering and Visualization Software Market
8.5.1 Key Market Trends, Growth Factors and Opportunities
8.5.2 Top Key Companies
8.5.3 Historic and Forecasted Market Size by Segments
8.5.4 Historic and Forecasted Market Size by Deployment
8.5.4.1 On-premises
8.5.4.2 Cloud
8.5.5 Historic and Forecasted Market Size by Applications
8.5.5.1 Consumer
8.5.5.2 Product Design and Modeling
8.5.5.3 Animation
8.5.5.4 Visualization and Simulation
8.5.5.5 Others (Marketing and Sales)
8.5.6 Historic and Forecasted Market Size by Industry
8.5.6.1 Architecture
8.5.6.2 Engineering
8.5.6.3 and Construction
8.5.6.4 Gaming & Entertainment
8.5.6.5 Healthcare
8.5.6.6 Manufacturing & Automotive
8.5.6.7 Others (Education)
8.5.7 Historic and Forecast Market Size by Country
8.5.7.1 China
8.5.7.2 India
8.5.7.3 Japan
8.5.7.4 South Korea
8.5.7.5 Malaysia
8.5.7.6 Thailand
8.5.7.7 Vietnam
8.5.7.8 The Philippines
8.5.7.9 Australia
8.5.7.10 New Zealand
8.5.7.11 Rest of APAC
8.6. Middle East & Africa 3D Rendering and Visualization Software Market
8.6.1 Key Market Trends, Growth Factors and Opportunities
8.6.2 Top Key Companies
8.6.3 Historic and Forecasted Market Size by Segments
8.6.4 Historic and Forecasted Market Size by Deployment
8.6.4.1 On-premises
8.6.4.2 Cloud
8.6.5 Historic and Forecasted Market Size by Applications
8.6.5.1 Consumer
8.6.5.2 Product Design and Modeling
8.6.5.3 Animation
8.6.5.4 Visualization and Simulation
8.6.5.5 Others (Marketing and Sales)
8.6.6 Historic and Forecasted Market Size by Industry
8.6.6.1 Architecture
8.6.6.2 Engineering
8.6.6.3 and Construction
8.6.6.4 Gaming & Entertainment
8.6.6.5 Healthcare
8.6.6.6 Manufacturing & Automotive
8.6.6.7 Others (Education)
8.6.7 Historic and Forecast Market Size by Country
8.6.7.1 Turkiye
8.6.7.2 Bahrain
8.6.7.3 Kuwait
8.6.7.4 Saudi Arabia
8.6.7.5 Qatar
8.6.7.6 UAE
8.6.7.7 Israel
8.6.7.8 South Africa
8.7. South America 3D Rendering and Visualization Software Market
8.7.1 Key Market Trends, Growth Factors and Opportunities
8.7.2 Top Key Companies
8.7.3 Historic and Forecasted Market Size by Segments
8.7.4 Historic and Forecasted Market Size by Deployment
8.7.4.1 On-premises
8.7.4.2 Cloud
8.7.5 Historic and Forecasted Market Size by Applications
8.7.5.1 Consumer
8.7.5.2 Product Design and Modeling
8.7.5.3 Animation
8.7.5.4 Visualization and Simulation
8.7.5.5 Others (Marketing and Sales)
8.7.6 Historic and Forecasted Market Size by Industry
8.7.6.1 Architecture
8.7.6.2 Engineering
8.7.6.3 and Construction
8.7.6.4 Gaming & Entertainment
8.7.6.5 Healthcare
8.7.6.6 Manufacturing & Automotive
8.7.6.7 Others (Education)
8.7.7 Historic and Forecast Market Size by Country
8.7.7.1 Brazil
8.7.7.2 Argentina
8.7.7.3 Rest of SA
Chapter 9 Analyst Viewpoint and Conclusion
9.1 Recommendations and Concluding Analysis
9.2 Potential Market Strategies
Chapter 10 Research Methodology
10.1 Research Process
10.2 Primary Research
10.3 Secondary Research
|
Global 3D Rendering and Visualization Software Market |
|||
|
Base Year: |
2023 |
Forecast Period: |
2024-2032 |
|
Historical Data: |
2017 to 2023 |
Market Size in 2023: |
USD 2.73 Bn. |
|
Forecast Period 2023-34 CAGR: |
6.3% |
Market Size in 2032: |
USD 14.17 Bn. |
|
Segments Covered: |
By Deployment |
|
|
|
By Applications |
|
||
|
By Industry |
|
||
|
By Region |
|
||
|
Key Market Drivers: |
|
||
|
Key Market Restraints: |
|
||
|
Key Opportunities: |
|
||
|
Companies Covered in the report: |
|
||


