1.1 KONE CORPORATION
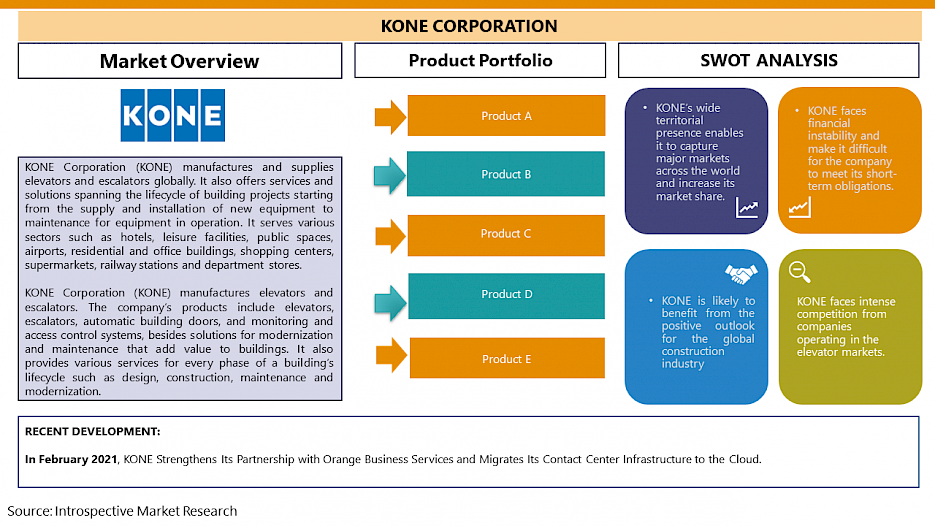
1.1.1 Company Overview
1.1.2 Key Executives
1.1.3 Company Snapshot
1.1.4 Operating Business Segments
1.1.5 Product Portfolio
1.1.6 Business Performance
1.1.7 Key Strategic Moves and Recent Developments
1.1.8 SWOT Analysis
TABLE 1. KONE CORPORATION: KEY EXECUTIVES
TABLE 2. KONE CORPORATION - PRODUCT PORTFOLIO
FIG. 1. KONE CORPORATION, REVENUE (2019–2022) IN USD MILLION
FIG. 2. KONE CORPORATION: REVENUE BY BUSINESS SEGMENTS, 2022 (%)
FIG. 3. KONE CORPORATION: REVENUE BY REGION, 2021 (%)
FIG. 4. KONE CORPORATION: SWOT ANALYSIS