


Global Spend Analysis Software Market Overview
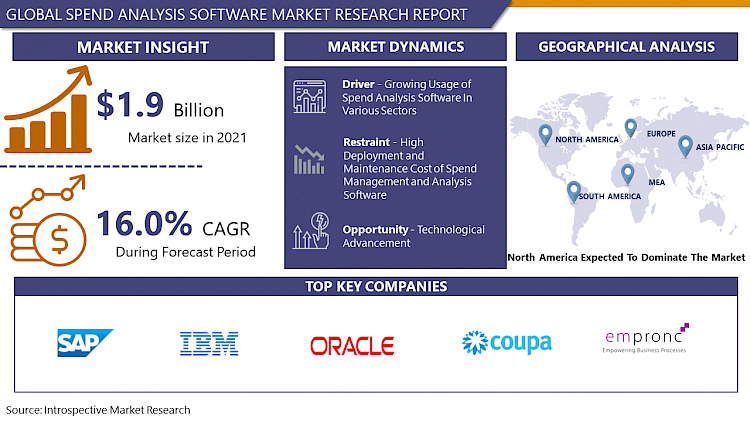
Spend Analysis Software Market size is projected to reach USD 5.4 Billion by 2028 from an estimated USD 1.9 Billion in 2021, growing at a CAGR of 16.0% globally.
Spend analysis or spending analysis is the collection, cleansing, classification, and analysis of spending data to reduce procurement costs, improve efficiency, and monitor control and compliance. Along with inventory management, contract management, and other processes, spend analysis is essential to running a business with large incoming and outgoing data which has monetary value. Business spending management software uses such algorithms to enable spending analysis. The world's industrial plants are becoming more and more automated. In today's expanding market, it is important to prioritize efficiency to increase production as needed and invest with a proven track record. Business expense management software enables automated management of a company's day-to-day expenses and investments, reducing human error and maximizing productivity.
Spend Analysis has evolved the way people and machines interact to use spending data by extending the data analytics process and data access. Various industry verticals in such as supply chain, logistics, BFSI, manufacturing, and retail are changing the dynamics of the market by adopting new solutions to optimize the business function. This helps organizations gain a competitive advantage and makes better use of their spending data. JAGGAER, one of the leading providers of spend management solutions, and iTiZZiMO, a German software company, have entered into a strategic partnership to create a mutually beneficial situation in the market ecosystem. The two companies are working together to expand JAGGAER's spending management product portfolio to include a mobile application-based solution for account and inventory management solutions. Such strategic advancement in the industry propels the growth of the Spend Analysis Software Market.
Market Dynamics And Key Factors For Spend Analysis Software Market
Drivers:
Benefits of spend analysis software include deeper insights and management through data visualization, support for deploying cost-cutting processes, easy access to large files, real-time data updates and localization, and improved system scalability. It reduces an organization's investment through better utilization and consumption. Retail and e-commerce are some of the sectors that rely on procurement and supply chain management systems along with data analytics. Companies in this sector have timely procurement and purchasing teams with solutions that analyse data quickly and accurately to achieve the highest possible return on investment for their products and businesses which allows you to make the right decisions. The retail and e-commerce sectors are a fast-paced environment for maximizing supply chain profitability. The decision is time-critical. This is one of the reasons why retail is one of the top implementers of spending analysis. These tools and platforms help procurement and purchasing teams quickly identify potential challenges in their supply chain. The most important part of making a good spending decision is to make sure that spending data from all data sources are accurately classified and up-to-date. This data can be used by visualized procurement teams to make informed and repeatable cost-cutting decisions.
Integrating Bluetooth and Wi-Fi into all appliances and devices has not only dramatically increased the speed and amount of data generation. Nevertheless, the quality of data generation is also improving and is expected to increase the demand for spend analysis, especially in the retail sector. Over the years, online business-to-business (B2B) transactions have increased significantly, and e-commerce procurement by major purchasing organizations has increased. These companies are interested in transforming their supply chain management solutions and integrating them with the new-age procurement system. Coupa, a cloud-based spend management software company, improves its Business Spend Management (BSM) solution by adding voice activation on Amazon Alexa to manage inventory, search for items, and reorder inventory. Advances in IoT technology and increasing potential for growing economies are also encouraging companies to expand the adoption of spending analysis tools to developing countries which further boosts the demand for spend analysis software in the market.
Restraints:
Due to the high deployment and maintenance cost of spend management and analysis software, adoption from small and medium enterprises has shown less interest. Although spend analysis software provides a great way of asportation, management, and recording the procurement and inward-outward entries which helps the business to operate efficiently, smaller companies cannot bear the higher cost to maintain such software for a longer period. Such businesses opt for traditional methods of track records and data management through online ledgers and non-digital methods. The higher cost of such software makes it a restraining factor for Spend Analysis Software Market
Opportunities:
While the trends in artificial intelligence (AI) and cognitive computing are still in their primary stage and advances in machine learning (ML) and natural language processing (NLP) have significantly changed spend analysis. With the development of these technologies, spend analysis activities are based on the interpretation of internal and external data sources (both structured and unstructured), visualization of descriptive and predictive results, and cognitive interaction with analysis. However, while these factors are only improved by spending analysis and established approaches to spending visibility, interpretation and behaviour still require human insight. As organizations embark on digital efforts and strive to scale up, big data and advanced spending and procurement approaches are expected to have a significant impact on procurement capabilities to generate new insights into the implementation of digital procurement strategies. Companies like Oracle, Capgemini, IBM, and SAP have been exploring the use of such technologies in the spend analysis software which can provide real-time monitoring and solution using AI and Machine Learning. The use of such technologies presents bright future opportunities in the Spend Analysis Software Market.
Market Segmentation
Segmentation Analysis of Spend Analysis Software Market:
By Type, The Cloud-based segment is dominating the market with the highest market share and is expected to grow substantially and dominate the global market during the forecast period. With cloud-based business spend management, businesses can improve efficiency and productivity by using automation to increase efficiency and eliminate the need for paperwork. This can be achieved by moving the request to an automated system that sends the request and notifies the appropriate approver. 74% of companies experience cloud-based platforms that have brought benefits based on speed, reliability, and ease of use. Information and business applications are hosted in the cloud, which facilitates remote access for various stakeholders. In the event of an error, employees can easily access the cloud system to provide actionable solutions in real-time. Due to technological advancement, robust cloud infrastructure provides a seamless solution in all parts of the world, enabling businesses to integrate the spend analysis software to boost operational performance.
By Application, the Large enterprise segment is dominating the Spend Analysis, Software Market. Large enterprises have massive incoming and outgoing data which is essential to manage accordingly to capitalize on the results, Therefore, large companies spend generously on data management and spend analysis software to manage, optimize and store data securely. Retail and Ecommerce companies with large volumes such as Amazon, Alibaba, and other companies with large inventory utilize spend analysis software to keep track of suppliers, vendors, and inward inventory to manage the internal functioning smoothly. Also, In the manufacturing sector, procurement of raw material, inventory management, supply chain of incoming and outgoing products as well as an accounting of such transactions is depending on spend analysis software. Therefore, it creates value among business entities to ease the operational process which reflects on the demand in the industry.
By End User, Retail & E-commerce is expected to dominate in the Spend Analysis Software Market. The retail and E-commerce sector is the largest user of spend analysis software in the industry. Heavy inventory management, large vendor orders, payment mechanism, current, and future orders, business receipts, and underlying paperwork are very important to sort, assess and manage. In such a situation, spend analysis software makes it efficient and effortless for a procurement professional to manage all data and help to make a real-time decision. For upstream sourcing (that is, a process focused on spending analysis and strategic sourcing), ease of use makes it easy to identify and optimize spending opportunities and implement suppliers and strategies based on key spending categories. It means providing procurement professionals with the advanced tools they need in the retail business. Therefore, the retail and ecommerce sector generate high demand in the Spend Analysis Software Market.
Regional Analysis of Spend Analysis Software Market:
North America is expected to have the highest market share in the spending analytics software market during the forecast period. In North America, the spending analytics software market is growing significantly as new technologies such as big data and cloud computing technologies are increasingly adopted. Digital transformation in North America has seen significant growth in recent years. The number of SMEs in the region is also increasing with the need for affordable spend analysis software and solution. There are many spending analysis software vendors in North America, including Oracle Corporation, IBM, SAP SE, and SAS Institute. The presence of such major vendors in the region is driving the growth of the North American region.
The Asia Pacific region is expected to become the fastest-growing market for spend analysis software as both consumers and businesses increasingly adopt analytics tools. Spending and revenue are growing in the big data and analytics sector, thereby driving the demand in the region's spending analytics market. The five potential and major industries that attract the largest investments in big data and analytics solutions in the Asia Pacific region are banking, telecommunications, individual manufacturing, central government, and professional services. The analytics market in the region is driven primarily by full digital adoption in all industries, including China, Japan, and India. The main drivers of analytics in China are the increasing speed of the Internet, the proliferation of mobile phones/smartphones, the increasing urbanization of machine learning, the development of algorithms, and the proliferation of data due to the need for customer and behavioural analytics.
Players Covered in Spend Analysis Software Market are:
- SAS Institute Inc.
- SAP SE
- IBM Corporation
- Coupa Software Inc.
- Oracle Corporation
- Zycus Inc.
- Empronc Solutions Pvt. Ltd.
- Rosslyn Analytics Ltd.
- JAGGAER
- Proactis
- Ivalua Inc.
- Zageno
- BravoSolution SPA and other major players.
Covid-19 Impact on Spend Analysis Software Market
With the outbreak of COVID19, a data science team is called in to process large amounts of available data, build optimal business spending models based on reliable data, and enable decision-makers to expedite emergency response plans. Companies are using AI, ML, and natural language processing to mine vast amounts of data to build predictive or regulatory models. Many companies are experiencing a variety of unexpected and unplanned supply chain disruptions During the COVID 19 pandemic spend analysis helped businesses better identify areas where money transactions are being carried on inefficiently. Intelligent and structured spend analysis, procurement, and e-procurement strategies based on digital solutions able provide proactive insights for activating and implementing emergency response plans in the face of a range of difficult circumstances. A major part of business operations moved to a digital platform, spend management, and analysis software companies have capitalized on such opportunities during the pandemic period. With moderate to high demand during a pandemic, the Spend Analysis Software Market is expected to grow at large during the forecasted period.
Recent Industry Developments In Spend Analysis Software Market
- August 2021, Coupa Launches the First Business Spend Management App Marketplace which is a leader in Business Spend Management (BSM), giving customers an easier and smarter way to extend the power of the leading BSM platform. The Coupa App Marketplace connects businesses with certified, pre-built solutions that create a seamless way to tap into a trusted global community of BSM partners.
- December 2020, LevaData announced that it will expand its collaboration with Zebra Technologies, the company's leading innovator, with solutions and partners that enable companies to achieve performance advantages. Zebra chose LevaData to further support direct material procurement, new product launches, and mitigation of global supply risk.
|
Global Spend Analysis Software Market |
|||
|
Base Year: |
2021 |
Forecast Period: |
2022-2028 |
|
Historical Data: |
2016 to 2020 |
Market Size in 2021: |
USD 1.9 Bn. |
|
Forecast Period 2022-28 CAGR: |
16.0% |
Market Size in 2028: |
USD 5.4 Bn. |
|
Segments Covered: |
By Type |
|
|
|
By Enterprise Size |
|
||
|
By End-User |
|
||
|
By Region |
|
||
|
Key Market Drivers: |
|
||
|
Key Market Restraints: |
|
||
|
Key Opportunities: |
|
||
|
Companies Covered in the report: |
|
||
Chapter 1: Introduction
1.1 Research Objectives
1.2 Research Methodology
1.3 Research Process
1.4 Scope and Coverage
1.4.1 Market Definition
1.4.2 Key Questions Answered
1.5 Market Segmentation
Chapter 2:Executive Summary
Chapter 3:Growth Opportunities By Segment
3.1 By Type
3.2 By Enterprise Size
3.3 By End-User
Chapter 4: Market Landscape
4.1 Porter's Five Forces Analysis
4.1.1 Bargaining Power of Supplier
4.1.2 Threat of New Entrants
4.1.3 Threat of Substitutes
4.1.4 Competitive Rivalry
4.1.5 Bargaining Power Among Buyers
4.2 Industry Value Chain Analysis
4.3 Market Dynamics
4.3.1 Drivers
4.3.2 Restraints
4.3.3 Opportunities
4.5.4 Challenges
4.4 Pestle Analysis
4.5 Technological Roadmap
4.6 Regulatory Landscape
4.7 SWOT Analysis
4.8 Price Trend Analysis
4.9 Patent Analysis
4.10 Analysis of the Impact of Covid-19
4.10.1 Impact on the Overall Market
4.10.2 Impact on the Supply Chain
4.10.3 Impact on the Key Manufacturers
4.10.4 Impact on the Pricing
Chapter 5: Spend Analysis Software Market by Type
5.1 Spend Analysis Software Market Overview Snapshot and Growth Engine
5.2 Spend Analysis Software Market Overview
5.3 Cloud
5.3.1 Introduction and Market Overview
5.3.2 Historic and Forecasted Market Size (2016-2028F)
5.3.3 Key Market Trends, Growth Factors and Opportunities
5.3.4 Cloud: Grographic Segmentation
5.4 On-Premises
5.4.1 Introduction and Market Overview
5.4.2 Historic and Forecasted Market Size (2016-2028F)
5.4.3 Key Market Trends, Growth Factors and Opportunities
5.4.4 On-Premises: Grographic Segmentation
Chapter 6: Spend Analysis Software Market by Enterprise Size
6.1 Spend Analysis Software Market Overview Snapshot and Growth Engine
6.2 Spend Analysis Software Market Overview
6.3 SMEs
6.3.1 Introduction and Market Overview
6.3.2 Historic and Forecasted Market Size (2016-2028F)
6.3.3 Key Market Trends, Growth Factors and Opportunities
6.3.4 SMEs: Grographic Segmentation
6.4 Large Enterprise
6.4.1 Introduction and Market Overview
6.4.2 Historic and Forecasted Market Size (2016-2028F)
6.4.3 Key Market Trends, Growth Factors and Opportunities
6.4.4 Large Enterprise: Grographic Segmentation
Chapter 7: Spend Analysis Software Market by End-User
7.1 Spend Analysis Software Market Overview Snapshot and Growth Engine
7.2 Spend Analysis Software Market Overview
7.3 Healthcare & Life Sciences
7.3.1 Introduction and Market Overview
7.3.2 Historic and Forecasted Market Size (2016-2028F)
7.3.3 Key Market Trends, Growth Factors and Opportunities
7.3.4 Healthcare & Life Sciences: Grographic Segmentation
7.4 Energy & Utilities
7.4.1 Introduction and Market Overview
7.4.2 Historic and Forecasted Market Size (2016-2028F)
7.4.3 Key Market Trends, Growth Factors and Opportunities
7.4.4 Energy & Utilities: Grographic Segmentation
7.5 Retail & E-Commerce
7.5.1 Introduction and Market Overview
7.5.2 Historic and Forecasted Market Size (2016-2028F)
7.5.3 Key Market Trends, Growth Factors and Opportunities
7.5.4 Retail & E-Commerce: Grographic Segmentation
7.6 Banking
7.6.1 Introduction and Market Overview
7.6.2 Historic and Forecasted Market Size (2016-2028F)
7.6.3 Key Market Trends, Growth Factors and Opportunities
7.6.4 Banking: Grographic Segmentation
7.7 Others
7.7.1 Introduction and Market Overview
7.7.2 Historic and Forecasted Market Size (2016-2028F)
7.7.3 Key Market Trends, Growth Factors and Opportunities
7.7.4 Others: Grographic Segmentation
Chapter 8: Company Profiles and Competitive Analysis
8.1 Competitive Landscape
8.1.1 Competitive Positioning
8.1.2 Spend Analysis Software Sales and Market Share By Players
8.1.3 Industry BCG Matrix
8.1.4 Ansoff Matrix
8.1.5 Spend Analysis Software Industry Concentration Ratio (CR5 and HHI)
8.1.6 Top 5 Spend Analysis Software Players Market Share
8.1.7 Mergers and Acquisitions
8.1.8 Business Strategies By Top Players
8.2 SAS INSTITUTE INC.
8.2.1 Company Overview
8.2.2 Key Executives
8.2.3 Company Snapshot
8.2.4 Operating Business Segments
8.2.5 Product Portfolio
8.2.6 Business Performance
8.2.7 Key Strategic Moves and Recent Developments
8.2.8 SWOT Analysis
8.3 SAP SE
8.4 IBM CORPORATION
8.5 COUPA SOFTWARE INC.
8.6 ORACLE CORPORATION
8.7 ZYCUS INC.
8.8 EMPRONC SOLUTIONS PVT. LTD.
8.9 ROSSLYN ANALYTICS LTD.
8.10 JAGGAER
8.11 PROACTIS
8.12 IVALUA INC.
8.13 ZAGENO
8.14 BRAVOSOLUTION SPA
8.15 OTHER MAJOR PLAYERS
Chapter 9: Global Spend Analysis Software Market Analysis, Insights and Forecast, 2016-2028
9.1 Market Overview
9.2 Historic and Forecasted Market Size By Type
9.2.1 Cloud
9.2.2 On-Premises
9.3 Historic and Forecasted Market Size By Enterprise Size
9.3.1 SMEs
9.3.2 Large Enterprise
9.4 Historic and Forecasted Market Size By End-User
9.4.1 Healthcare & Life Sciences
9.4.2 Energy & Utilities
9.4.3 Retail & E-Commerce
9.4.4 Banking
9.4.5 Others
Chapter 10: North America Spend Analysis Software Market Analysis, Insights and Forecast, 2016-2028
10.1 Key Market Trends, Growth Factors and Opportunities
10.2 Impact of Covid-19
10.3 Key Players
10.4 Key Market Trends, Growth Factors and Opportunities
10.4 Historic and Forecasted Market Size By Type
10.4.1 Cloud
10.4.2 On-Premises
10.5 Historic and Forecasted Market Size By Enterprise Size
10.5.1 SMEs
10.5.2 Large Enterprise
10.6 Historic and Forecasted Market Size By End-User
10.6.1 Healthcare & Life Sciences
10.6.2 Energy & Utilities
10.6.3 Retail & E-Commerce
10.6.4 Banking
10.6.5 Others
10.7 Historic and Forecast Market Size by Country
10.7.1 U.S.
10.7.2 Canada
10.7.3 Mexico
Chapter 11: Europe Spend Analysis Software Market Analysis, Insights and Forecast, 2016-2028
11.1 Key Market Trends, Growth Factors and Opportunities
11.2 Impact of Covid-19
11.3 Key Players
11.4 Key Market Trends, Growth Factors and Opportunities
11.4 Historic and Forecasted Market Size By Type
11.4.1 Cloud
11.4.2 On-Premises
11.5 Historic and Forecasted Market Size By Enterprise Size
11.5.1 SMEs
11.5.2 Large Enterprise
11.6 Historic and Forecasted Market Size By End-User
11.6.1 Healthcare & Life Sciences
11.6.2 Energy & Utilities
11.6.3 Retail & E-Commerce
11.6.4 Banking
11.6.5 Others
11.7 Historic and Forecast Market Size by Country
11.7.1 Germany
11.7.2 U.K.
11.7.3 France
11.7.4 Italy
11.7.5 Russia
11.7.6 Spain
11.7.7 Rest of Europe
Chapter 12: Asia-Pacific Spend Analysis Software Market Analysis, Insights and Forecast, 2016-2028
12.1 Key Market Trends, Growth Factors and Opportunities
12.2 Impact of Covid-19
12.3 Key Players
12.4 Key Market Trends, Growth Factors and Opportunities
12.4 Historic and Forecasted Market Size By Type
12.4.1 Cloud
12.4.2 On-Premises
12.5 Historic and Forecasted Market Size By Enterprise Size
12.5.1 SMEs
12.5.2 Large Enterprise
12.6 Historic and Forecasted Market Size By End-User
12.6.1 Healthcare & Life Sciences
12.6.2 Energy & Utilities
12.6.3 Retail & E-Commerce
12.6.4 Banking
12.6.5 Others
12.7 Historic and Forecast Market Size by Country
12.7.1 China
12.7.2 India
12.7.3 Japan
12.7.4 Singapore
12.7.5 Australia
12.7.6 New Zealand
12.7.7 Rest of APAC
Chapter 13: Middle East & Africa Spend Analysis Software Market Analysis, Insights and Forecast, 2016-2028
13.1 Key Market Trends, Growth Factors and Opportunities
13.2 Impact of Covid-19
13.3 Key Players
13.4 Key Market Trends, Growth Factors and Opportunities
13.4 Historic and Forecasted Market Size By Type
13.4.1 Cloud
13.4.2 On-Premises
13.5 Historic and Forecasted Market Size By Enterprise Size
13.5.1 SMEs
13.5.2 Large Enterprise
13.6 Historic and Forecasted Market Size By End-User
13.6.1 Healthcare & Life Sciences
13.6.2 Energy & Utilities
13.6.3 Retail & E-Commerce
13.6.4 Banking
13.6.5 Others
13.7 Historic and Forecast Market Size by Country
13.7.1 Turkey
13.7.2 Saudi Arabia
13.7.3 Iran
13.7.4 UAE
13.7.5 Africa
13.7.6 Rest of MEA
Chapter 14: South America Spend Analysis Software Market Analysis, Insights and Forecast, 2016-2028
14.1 Key Market Trends, Growth Factors and Opportunities
14.2 Impact of Covid-19
14.3 Key Players
14.4 Key Market Trends, Growth Factors and Opportunities
14.4 Historic and Forecasted Market Size By Type
14.4.1 Cloud
14.4.2 On-Premises
14.5 Historic and Forecasted Market Size By Enterprise Size
14.5.1 SMEs
14.5.2 Large Enterprise
14.6 Historic and Forecasted Market Size By End-User
14.6.1 Healthcare & Life Sciences
14.6.2 Energy & Utilities
14.6.3 Retail & E-Commerce
14.6.4 Banking
14.6.5 Others
14.7 Historic and Forecast Market Size by Country
14.7.1 Brazil
14.7.2 Argentina
14.7.3 Rest of SA
Chapter 15 Investment Analysis
Chapter 16 Analyst Viewpoint and Conclusion
|
Global Spend Analysis Software Market |
|||
|
Base Year: |
2021 |
Forecast Period: |
2022-2028 |
|
Historical Data: |
2016 to 2020 |
Market Size in 2021: |
USD 1.9 Bn. |
|
Forecast Period 2022-28 CAGR: |
16.0% |
Market Size in 2028: |
USD 5.4 Bn. |
|
Segments Covered: |
By Type |
|
|
|
By Enterprise Size |
|
||
|
By End-User |
|
||
|
By Region |
|
||
|
Key Market Drivers: |
|
||
|
Key Market Restraints: |
|
||
|
Key Opportunities: |
|
||
|
Companies Covered in the report: |
|
||
LIST OF TABLES
TABLE 001. EXECUTIVE SUMMARY
TABLE 002. SPEND ANALYSIS SOFTWARE MARKET BARGAINING POWER OF SUPPLIERS
TABLE 003. SPEND ANALYSIS SOFTWARE MARKET BARGAINING POWER OF CUSTOMERS
TABLE 004. SPEND ANALYSIS SOFTWARE MARKET COMPETITIVE RIVALRY
TABLE 005. SPEND ANALYSIS SOFTWARE MARKET THREAT OF NEW ENTRANTS
TABLE 006. SPEND ANALYSIS SOFTWARE MARKET THREAT OF SUBSTITUTES
TABLE 007. SPEND ANALYSIS SOFTWARE MARKET BY TYPE
TABLE 008. CLOUD MARKET OVERVIEW (2016-2028)
TABLE 009. ON-PREMISES MARKET OVERVIEW (2016-2028)
TABLE 010. SPEND ANALYSIS SOFTWARE MARKET BY ENTERPRISE SIZE
TABLE 011. SMES MARKET OVERVIEW (2016-2028)
TABLE 012. LARGE ENTERPRISE MARKET OVERVIEW (2016-2028)
TABLE 013. SPEND ANALYSIS SOFTWARE MARKET BY END-USER
TABLE 014. HEALTHCARE & LIFE SCIENCES MARKET OVERVIEW (2016-2028)
TABLE 015. ENERGY & UTILITIES MARKET OVERVIEW (2016-2028)
TABLE 016. RETAIL & E-COMMERCE MARKET OVERVIEW (2016-2028)
TABLE 017. BANKING MARKET OVERVIEW (2016-2028)
TABLE 018. OTHERS MARKET OVERVIEW (2016-2028)
TABLE 019. NORTH AMERICA SPEND ANALYSIS SOFTWARE MARKET, BY TYPE (2016-2028)
TABLE 020. NORTH AMERICA SPEND ANALYSIS SOFTWARE MARKET, BY ENTERPRISE SIZE (2016-2028)
TABLE 021. NORTH AMERICA SPEND ANALYSIS SOFTWARE MARKET, BY END-USER (2016-2028)
TABLE 022. N SPEND ANALYSIS SOFTWARE MARKET, BY COUNTRY (2016-2028)
TABLE 023. EUROPE SPEND ANALYSIS SOFTWARE MARKET, BY TYPE (2016-2028)
TABLE 024. EUROPE SPEND ANALYSIS SOFTWARE MARKET, BY ENTERPRISE SIZE (2016-2028)
TABLE 025. EUROPE SPEND ANALYSIS SOFTWARE MARKET, BY END-USER (2016-2028)
TABLE 026. SPEND ANALYSIS SOFTWARE MARKET, BY COUNTRY (2016-2028)
TABLE 027. ASIA PACIFIC SPEND ANALYSIS SOFTWARE MARKET, BY TYPE (2016-2028)
TABLE 028. ASIA PACIFIC SPEND ANALYSIS SOFTWARE MARKET, BY ENTERPRISE SIZE (2016-2028)
TABLE 029. ASIA PACIFIC SPEND ANALYSIS SOFTWARE MARKET, BY END-USER (2016-2028)
TABLE 030. SPEND ANALYSIS SOFTWARE MARKET, BY COUNTRY (2016-2028)
TABLE 031. MIDDLE EAST & AFRICA SPEND ANALYSIS SOFTWARE MARKET, BY TYPE (2016-2028)
TABLE 032. MIDDLE EAST & AFRICA SPEND ANALYSIS SOFTWARE MARKET, BY ENTERPRISE SIZE (2016-2028)
TABLE 033. MIDDLE EAST & AFRICA SPEND ANALYSIS SOFTWARE MARKET, BY END-USER (2016-2028)
TABLE 034. SPEND ANALYSIS SOFTWARE MARKET, BY COUNTRY (2016-2028)
TABLE 035. SOUTH AMERICA SPEND ANALYSIS SOFTWARE MARKET, BY TYPE (2016-2028)
TABLE 036. SOUTH AMERICA SPEND ANALYSIS SOFTWARE MARKET, BY ENTERPRISE SIZE (2016-2028)
TABLE 037. SOUTH AMERICA SPEND ANALYSIS SOFTWARE MARKET, BY END-USER (2016-2028)
TABLE 038. SPEND ANALYSIS SOFTWARE MARKET, BY COUNTRY (2016-2028)
TABLE 039. SAS INSTITUTE INC.: SNAPSHOT
TABLE 040. SAS INSTITUTE INC.: BUSINESS PERFORMANCE
TABLE 041. SAS INSTITUTE INC.: PRODUCT PORTFOLIO
TABLE 042. SAS INSTITUTE INC.: KEY STRATEGIC MOVES AND DEVELOPMENTS
TABLE 042. SAP SE: SNAPSHOT
TABLE 043. SAP SE: BUSINESS PERFORMANCE
TABLE 044. SAP SE: PRODUCT PORTFOLIO
TABLE 045. SAP SE: KEY STRATEGIC MOVES AND DEVELOPMENTS
TABLE 045. IBM CORPORATION: SNAPSHOT
TABLE 046. IBM CORPORATION: BUSINESS PERFORMANCE
TABLE 047. IBM CORPORATION: PRODUCT PORTFOLIO
TABLE 048. IBM CORPORATION: KEY STRATEGIC MOVES AND DEVELOPMENTS
TABLE 048. COUPA SOFTWARE INC.: SNAPSHOT
TABLE 049. COUPA SOFTWARE INC.: BUSINESS PERFORMANCE
TABLE 050. COUPA SOFTWARE INC.: PRODUCT PORTFOLIO
TABLE 051. COUPA SOFTWARE INC.: KEY STRATEGIC MOVES AND DEVELOPMENTS
TABLE 051. ORACLE CORPORATION: SNAPSHOT
TABLE 052. ORACLE CORPORATION: BUSINESS PERFORMANCE
TABLE 053. ORACLE CORPORATION: PRODUCT PORTFOLIO
TABLE 054. ORACLE CORPORATION: KEY STRATEGIC MOVES AND DEVELOPMENTS
TABLE 054. ZYCUS INC.: SNAPSHOT
TABLE 055. ZYCUS INC.: BUSINESS PERFORMANCE
TABLE 056. ZYCUS INC.: PRODUCT PORTFOLIO
TABLE 057. ZYCUS INC.: KEY STRATEGIC MOVES AND DEVELOPMENTS
TABLE 057. EMPRONC SOLUTIONS PVT. LTD.: SNAPSHOT
TABLE 058. EMPRONC SOLUTIONS PVT. LTD.: BUSINESS PERFORMANCE
TABLE 059. EMPRONC SOLUTIONS PVT. LTD.: PRODUCT PORTFOLIO
TABLE 060. EMPRONC SOLUTIONS PVT. LTD.: KEY STRATEGIC MOVES AND DEVELOPMENTS
TABLE 060. ROSSLYN ANALYTICS LTD.: SNAPSHOT
TABLE 061. ROSSLYN ANALYTICS LTD.: BUSINESS PERFORMANCE
TABLE 062. ROSSLYN ANALYTICS LTD.: PRODUCT PORTFOLIO
TABLE 063. ROSSLYN ANALYTICS LTD.: KEY STRATEGIC MOVES AND DEVELOPMENTS
TABLE 063. JAGGAER: SNAPSHOT
TABLE 064. JAGGAER: BUSINESS PERFORMANCE
TABLE 065. JAGGAER: PRODUCT PORTFOLIO
TABLE 066. JAGGAER: KEY STRATEGIC MOVES AND DEVELOPMENTS
TABLE 066. PROACTIS: SNAPSHOT
TABLE 067. PROACTIS: BUSINESS PERFORMANCE
TABLE 068. PROACTIS: PRODUCT PORTFOLIO
TABLE 069. PROACTIS: KEY STRATEGIC MOVES AND DEVELOPMENTS
TABLE 069. IVALUA INC.: SNAPSHOT
TABLE 070. IVALUA INC.: BUSINESS PERFORMANCE
TABLE 071. IVALUA INC.: PRODUCT PORTFOLIO
TABLE 072. IVALUA INC.: KEY STRATEGIC MOVES AND DEVELOPMENTS
TABLE 072. ZAGENO: SNAPSHOT
TABLE 073. ZAGENO: BUSINESS PERFORMANCE
TABLE 074. ZAGENO: PRODUCT PORTFOLIO
TABLE 075. ZAGENO: KEY STRATEGIC MOVES AND DEVELOPMENTS
TABLE 075. BRAVOSOLUTION SPA: SNAPSHOT
TABLE 076. BRAVOSOLUTION SPA: BUSINESS PERFORMANCE
TABLE 077. BRAVOSOLUTION SPA: PRODUCT PORTFOLIO
TABLE 078. BRAVOSOLUTION SPA: KEY STRATEGIC MOVES AND DEVELOPMENTS
TABLE 078. OTHER MAJOR PLAYERS: SNAPSHOT
TABLE 079. OTHER MAJOR PLAYERS: BUSINESS PERFORMANCE
TABLE 080. OTHER MAJOR PLAYERS: PRODUCT PORTFOLIO
TABLE 081. OTHER MAJOR PLAYERS: KEY STRATEGIC MOVES AND DEVELOPMENTS
LIST OF FIGURES
FIGURE 001. YEARS CONSIDERED FOR ANALYSIS
FIGURE 002. SCOPE OF THE STUDY
FIGURE 003. SPEND ANALYSIS SOFTWARE MARKET OVERVIEW BY REGIONS
FIGURE 004. PORTER'S FIVE FORCES ANALYSIS
FIGURE 005. BARGAINING POWER OF SUPPLIERS
FIGURE 006. COMPETITIVE RIVALRYFIGURE 007. THREAT OF NEW ENTRANTS
FIGURE 008. THREAT OF SUBSTITUTES
FIGURE 009. VALUE CHAIN ANALYSIS
FIGURE 010. PESTLE ANALYSIS
FIGURE 011. SPEND ANALYSIS SOFTWARE MARKET OVERVIEW BY TYPE
FIGURE 012. CLOUD MARKET OVERVIEW (2016-2028)
FIGURE 013. ON-PREMISES MARKET OVERVIEW (2016-2028)
FIGURE 014. SPEND ANALYSIS SOFTWARE MARKET OVERVIEW BY ENTERPRISE SIZE
FIGURE 015. SMES MARKET OVERVIEW (2016-2028)
FIGURE 016. LARGE ENTERPRISE MARKET OVERVIEW (2016-2028)
FIGURE 017. SPEND ANALYSIS SOFTWARE MARKET OVERVIEW BY END-USER
FIGURE 018. HEALTHCARE & LIFE SCIENCES MARKET OVERVIEW (2016-2028)
FIGURE 019. ENERGY & UTILITIES MARKET OVERVIEW (2016-2028)
FIGURE 020. RETAIL & E-COMMERCE MARKET OVERVIEW (2016-2028)
FIGURE 021. BANKING MARKET OVERVIEW (2016-2028)
FIGURE 022. OTHERS MARKET OVERVIEW (2016-2028)
FIGURE 023. NORTH AMERICA SPEND ANALYSIS SOFTWARE MARKET OVERVIEW BY COUNTRY (2016-2028)
FIGURE 024. EUROPE SPEND ANALYSIS SOFTWARE MARKET OVERVIEW BY COUNTRY (2016-2028)
FIGURE 025. ASIA PACIFIC SPEND ANALYSIS SOFTWARE MARKET OVERVIEW BY COUNTRY (2016-2028)
FIGURE 026. MIDDLE EAST & AFRICA SPEND ANALYSIS SOFTWARE MARKET OVERVIEW BY COUNTRY (2016-2028)
FIGURE 027. SOUTH AMERICA SPEND ANALYSIS SOFTWARE MARKET OVERVIEW BY COUNTRY (2016-2028)
Frequently Asked Questions :
The forecast period in the Spend Analysis Software Market research report is 2022-2028.
SAS Institute Inc., SAP SE, IBM Corporation, Coupa Software Inc., Oracle Corporation, Zycus Inc., Empronc Solutions Pvt. Ltd., Rosslyn Analytics Ltd., JAGGAER, Proactis, Ivalua Inc., Zageno, BravoSolution SPA, and other major players.
The Spend Analysis Software Market is segmented into Type, Enterprise Size, End-User, and region. By Type, the market is categorized into Cloud, On-Premises. By Enterprise size, the market is categorized into SMEs and Large Enterprises. By End-User, the market is categorized into Healthcare & Life Sciences, Energy & Utilities, Retail & E-Commerce, Banking, and Others. By region, it is analyzed across North America (U.S.; Canada; Mexico), Europe (Germany; U.K.; France; Italy; Russia; Spain, etc.), Asia-Pacific (China; India; Japan; Southeast Asia, etc.), South America (Brazil; Argentina, etc.), Middle East & Africa (Saudi Arabia; South Africa, etc.).
Spend analysis or spending analysis is the collection, cleansing, classification, and analysis of spending data to reduce procurement costs, improve efficiency, and monitor control and compliance. Along with inventory management, contract management, and other processes, spend analysis is essential to running a business with large incoming and outgoing data which has monetary value.
Spend Analysis Software Market size is projected to reach USD 5.4 Billion by 2028 from an estimated USD 1.9 Billion in 2021, growing at a CAGR of 16.0% globally.


