


Global Smart Transportation Market Overview
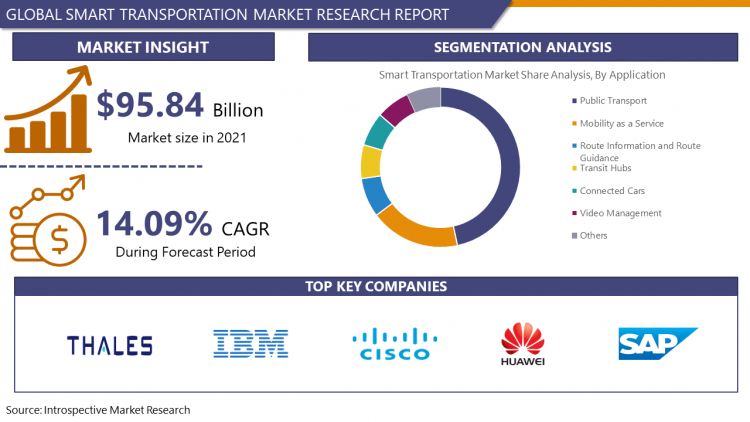
Global Smart Transportation Market was estimated at USD 95.84 billion in 2021 and is anticipated to reach USD 241.15 billion by 2028, growing at a CAGR of 14.09% globally.
Smart Transportation Systems uses a wide range of technologies such as traffic signal control systems, automatic number plate recognition, container management systems, or speed cameras such as security CCTV systems to evaluate, manage, and monitor transportation systems to improve efficiency and safety in transportation services. Smart transportation aims at using Artificial Intelligence to shift the burden of transportation infrastructure and managing vehicles from humans to automated technologies, to decrease the human costs of crashes involved. Smart transportation technologies provide innovative services to several transport modes and enable consumers to plan their routes more safely and smartly. Moreover, the development of smart cities will propel the growth of the smart transportation market in the period of forecast.
Furthermore, the rollout of 5G and technological advancements in artificial intelligence and embedded systems, can significantly enhance the networking and performance processing of smart vehicles. Additionally, 5G advancements such as side link transmission can crucially enhance peer-to-peer communication among mobile devices and vehicles. This quality to communicate directly without cell tower facilitation provides proximity services such as parking, lighting, maps, wayfinding, and centimeter positioning accuracy. All these factors are promoting the smart transportation market expansion throughout the forecast. Furthermore, travel delays exhaust around three billion gallons of fuel and near about seven billion hours of citizens. In 2015, it was estimated that Americans waste about 75 billion hours in traffic and that smart transportation could save US$507 billion in productivity, US$488 billion in accident reduction, and US$138 billion in productivity savings owing to reduced congestion of vehicles.
COVID-19 Impact on Smart Transportation Market
The outbreak of COVID-19 has affected various industries worldwide. Moreover, to constrain the spread of coronavirus restrictions have been imposed by governments on gatherings of people and transportation, as a result, there will be fewer humans in vehicles and transportation. Additionally, even though people are getting vaccinated against COVID-19, a significant percentage of the population will still be afraid to travel in crowded buses. Furthermore, the COVID-19 pandemic has paused many ongoing smart city and transportation projects. The financial stress attributed to the COVID-19 pandemic has forced the global economy into recession and has negatively impacted the adoption of technology in transportation. The recession has resulted in a delay in Autonomous Driving and Advanced Driver Assistance Systems integration in cars. Research and development projects are being scaled down and predicted timelines have been adjusted. Furthermore, the automotive industry was already in recession even before the COVID-19 pandemic, and the aftermath has created a more dip to this recession and thus has hampered Smart transportation market growth.
Market Dynamics and Key Factors in Smart Transportation Market
Drivers:
By combining machine learning with IoT and 5G, smart transportation has proven to decrease the human component in accidents attributed to the fact, computers don't get distracted or fatigued, or emotional. Moreover, the collection of data is the vital key, responsible for public management of infrastructure further, smart transportation provides detailed data points for every aspect of the transportation system, but allows administrators to better monitor operations, track maintenance needs, and identify key sources of problems that need to be fixed thus, supporting the growth of smart transportation market in the period of forecast.
Furthermore, smart transportation allows traffic management systems to quickly analyze congestion on city roads and accordingly divert traffic. Smart transportation has proven to be more efficient owing to factors such as, an adjustment in timing of train schedules can aid in increasing the fill rates and bus facilities can efficiently serve the consumers if stops are allocated according to the area-wise density of population. Moreover, smart transportation offers a navigation system to the user to find the best suitable route based on real-time conditions.
Users can ride public transport buses which turns red traffic light into green upon arrival. Additionally, it offers travelers with information about road conditions, weather emergencies, and manage fuel consumption. All these factors are strengthening the growth of the smart transportation market throughout the forecast. Moreover, smart transportation provides information about parking areas in the vicinity with the help of GPS. Smart transportation alerts drivers about hazardous situations in time to avoid crashes.
Restraints:
Artificial intelligence is the latest innovative technology that provides solutions to every aspect of transportation mode. The difficulty in the utilization of Artificial intelligence in a congested area or a mixed traffic region is hampering the growth of the Smart Transportation Market in the forecast period. Moreover, the complexity involved in understanding the use of smart transportation services is further restricting the Smart Transportation Market growth. The major factor hindering the Smart Transportation Market growth is the cost of the equipment involved in the smart transportation services and high maintenance costs. Furthermore, the software system that controls the transportation system can be hacked by hackers. In certain instances, such as an emergency or congestion due to an accident, the smart transportation system can't make a quick and accurate response. Additionally, the limited availability of data collection systems is further hampering the Smart Transportation Market growth throughout the forecast period.
Opportunities:
The growing trend of autonomous vehicles for public, private, and freight transportation has witnessed a rapid evolution owing to technological advancements in artificial intelligence and the Internet of things. These automatic vehicles require minimal or no human intervention. The curiosity of driverless vehicles among the general population is instigating market players to launch vehicles that can be operated with the help of AI and IoT (Internet on Things). The increase in the number of road accidents and the time required for medical services to reach accident spots through the congested traffic areas is providing opportunities for market players of Smart Transportation such as to build road maps for medical services to reach accident spots in time. The growing inconvenience of parking due to rising vehicle numbers and the irritation of freight transportation to the local population are generating ample opportunities for market players of smart transportation.
Challenges:
Providing accurate road data for roadway transportation and the correct time of arrival and departure of airlines and railways are the major challenges for market players of smart transportation. Moreover, developing public-private partnerships and collaborating with institutions to resolve air quality, traffic congestion, and sustainability issues are some major challenges. Furthermore, to minimize the cost involved in the developments of smart transportation and the open nature of smart transportation as wireless communication which can cause many securities and privacy challenges are some challenges that are posing threats to the implementation of smart transportation.
Market Segmentation
Segmentation Analysis of Smart Transportation Market:
Depending on Transportation Mode, Smart Transportation Market is segmented into roadways, railways, airways, and maritime. The roadways segment is anticipated to dominate the market in the period of forecast attributed to factors such as enhancement in road safety for the driver, pedestrians, and passengers, to reduce the accident rates in high-density populated regions. Moreover, the majority of the population uses roadways to carry out their day-to-day activities. The railway segment is estimated to have the second-highest share in Smart Transportation Market owing to the huge number of individuals using railways for long-distance routes.
Depending on the Technology Used, Smart Transportation Market is segmented into cloud computing, artificial intelligence, and the Internet of Things. The artificial intelligence segment is expected to dominate the market attributed the factors such as it helps in making transportation modes safer and comfortable. Moreover, Artificial intelligence can also analyze a large amount of data and help the service provider to plan, design, and control road transport networks. Internet of things is estimated to have the highest growth rate in the market owing to the advancement and development in this segment. Moreover, the connection of automobiles to the internet of things is expected to reduce accident rates thus boosting the segment growth. The combination of AI and cloud computing is a segment to watch out for but as this innovative technology is only in talks, nothing can be predicted on this.
Depending upon the Solution, the traffic management sector is anticipated to have the highest market share in the period of forecast. The growing number of vehicles has resulted in congestion, air pollution, and an increase in road accidents. Moreover, to provide medical services more efficiently and on time, traffic management is very important. Furthermore, to reduce the emission of greenhouse gases in urban areas traffic management has proven effective thus promoting the growth of traffic management solutions in the period of forecast. The ticket management system is estimated to have the second-highest share in the market owing to the convenience it provides by generating electronic tickets instead of conventional ticketing systems.
Depending upon the Application, public transport is expected to dominate the Smart Transportation Market. The growing awareness about global warming among individuals and the inconvenience caused due to a large number of private vehicles is encouraging consumers to use public transport. Moreover, to provide efficient service in public transport many governments have invested in the development of public transport thus promoting the growth of this segment.
Regional Analysis of Smart Transportation Market:
Europe region is anticipated to dominate the Smart Transportation Market in the period of forecast owing to the growing number of deployments of smart transportation systems. Moreover, the governments and private sector in this region are turning to information and communication technologies to resolve transportation issues. Greece and United Kingdom are the major countries in this region promoting the growth of the smart transportation market in this region. Furthermore, under the current EU funding scheme, the governments have announced to invest US$17.5 billion in railway infrastructure and US$36.6 billion for the development of road infrastructure for smart transportation.
Followed by Europe, the North American region is expected to dominate the Smart Transportation Market in the period of forecast. With the growing adoption of innovative technologies and to make transportation systems reliable, safe, and comfortable countries such as the United States and Canada are investing to develop road, railway, and airway infrastructure.
Asia-Pacific is expected to have the highest growth rate owing to robust growing economies like Japan, China, India, Singapore, and Australia. The technology advancements in Japan and ease at which smart transportation is accommodated is promoting Smart Transportation Market growth. China is the world's second-largest economy and the most populated country is investing in smart transportation to resolve the countries congestion problem hence all these factors are promoting the growth of the Smart Transportation Market in this region.
Players Covered in Smart Transportation Market are:
- Thales Group (France)
- Huawei Technologies Co. Ltd. (China)
- Siemens AG (Germany)
- IBM Corporation (US)
- Cisco Systems Inc. (US)
- SAP (Germany)
- Cubic Corporation (US)
- Alstom (France)
- Bombardier Inc. (Canada)
- Toshiba (Japan)
- Harris Corporation (US)
- Saab AB (Sweden)
- Veson Nautical (Massachusetts)
- BASS Software (Norway)
- Bentley Systems (US)
- Indra Sistemas (Spain)
- Trimble (US)
- TomTom International BV. (Netherlands)
- Amadeus IT Group SA (Spain)
- Conduent (US)
- Kapsch (Austria)
- Hitachi Ltd. (Japan)
- Descartes (Canada)
- Accenture (Ireland)
- DNV GL (Norway) and other major players
Key Industry Development in Smart Transportation Market
- In March 2021, Thales announced new digital services for railway transportation. With the help of the test metro signaling system SelTra G8, operators can observe a reduction in maintenance and installation costs while upgrading system functionalities to meet the demands of passengers such as safety and service reliability. It will also help operators to provide real-time passenger density with the help of CCTV cameras deployed on railway stations with an accuracy rate above 90%.
- In October 2021, Siemens Mobility announced that it has completed the acquisition of Sqills, a Netherlands-based company. With this acquisition, Sqills will function as a separate legal organization and a wholly-owned division of Siemens Mobility, an agreement that will allow Sqills to consolidate its leading position in providing innovative, smart, and comprehensive mobility solutions. Sqills is a global leading provider of cloud-based inventory management, ticketing software, and reservation to public transport operators across the globe.
|
Global Smart Transportation Market |
|||
|
Base Year: |
2021 |
Forecast Period: |
2022-2028 |
|
Historical Data : |
2016 to 2020 |
Market Size in 2021: |
USD 95.84 Bn. |
|
Forecast Period 2022-28 CAGR: |
14.09% |
Market Size in 2028: |
USD 241.15 Bn. |
|
Segments Covered: |
By Type |
|
|
|
By Technology Used |
|
||
|
By Solutions |
|
||
|
By Application |
|
||
|
By Region |
|
||
|
Key Market Drivers: |
|
||
|
Key Market Restraints: |
|
||
|
Key Opportunities: |
|
||
|
Companies Covered in the report: |
Thales Group (France), Huawei Technologies Co., Ltd. (China), Siemens AG (Germany), IBM Corporation (US), Cisco Systems, Inc. (US), SAP (Germany), Cubic Corporation (US), Alstom (France), Bombardier Inc. (Canada), Toshiba (Japan) and other major players |
||
Chapter 1: Introduction
1.1 Research Objectives
1.2 Research Methodology
1.3 Research Process
1.4 Scope and Coverage
1.4.1 Market Definition
1.4.2 Key Questions Answered
1.5 Market Segmentation
Chapter 2:Executive Summary
Chapter 3:Growth Opportunities By Segment
3.1 By Transportation Mode
3.2 By Technology Used
3.3 By Solutions
3.4 By Application
Chapter 4: Market Landscape
4.1 Porter's Five Forces Analysis
4.1.1 Bargaining Power of Supplier
4.1.2 Threat of New Entrants
4.1.3 Threat of Substitutes
4.1.4 Competitive Rivalry
4.1.5 Bargaining Power Among Buyers
4.2 Industry Value Chain Analysis
4.3 Market Dynamics
3.5.1 Drivers
3.5.2 Restraints
3.5.3 Opportunities
3.5.4 Challenges
4.4 Pestle Analysis
4.5 Technological Roadmap
4.6 Regulatory Landscape
4.7 SWOT Analysis
4.8 Price Trend Analysis
4.9 Patent Analysis
4.10 Analysis of the Impact of Covid-19
4.10.1 Impact on the Overall Market
4.10.2 Impact on the Supply Chain
4.10.3 Impact on the Key Manufacturers
4.10.4 Impact on the Pricing
Chapter 4: Smart Transportation Market by Transportation Mode
4.1 Smart Transportation Market Overview Snapshot and Growth Engine
4.2 Smart Transportation Market Overview
4.3 Roadways
4.3.1 Introduction and Market Overview
4.3.2 Historic and Forecasted Market Size (2016-2028F)
4.3.3 Key Market Trends, Growth Factors and Opportunities
4.3.4 Roadways: Grographic Segmentation
4.4 Railways
4.4.1 Introduction and Market Overview
4.4.2 Historic and Forecasted Market Size (2016-2028F)
4.4.3 Key Market Trends, Growth Factors and Opportunities
4.4.4 Railways: Grographic Segmentation
4.5 Airways
4.5.1 Introduction and Market Overview
4.5.2 Historic and Forecasted Market Size (2016-2028F)
4.5.3 Key Market Trends, Growth Factors and Opportunities
4.5.4 Airways: Grographic Segmentation
4.6 Maritime
4.6.1 Introduction and Market Overview
4.6.2 Historic and Forecasted Market Size (2016-2028F)
4.6.3 Key Market Trends, Growth Factors and Opportunities
4.6.4 Maritime: Grographic Segmentation
Chapter 5: Smart Transportation Market by Technology Used
5.1 Smart Transportation Market Overview Snapshot and Growth Engine
5.2 Smart Transportation Market Overview
5.3 Cloud Computing
5.3.1 Introduction and Market Overview
5.3.2 Historic and Forecasted Market Size (2016-2028F)
5.3.3 Key Market Trends, Growth Factors and Opportunities
5.3.4 Cloud Computing: Grographic Segmentation
5.4 Artificial Intelligence
5.4.1 Introduction and Market Overview
5.4.2 Historic and Forecasted Market Size (2016-2028F)
5.4.3 Key Market Trends, Growth Factors and Opportunities
5.4.4 Artificial Intelligence: Grographic Segmentation
5.5 Internet Of Things
5.5.1 Introduction and Market Overview
5.5.2 Historic and Forecasted Market Size (2016-2028F)
5.5.3 Key Market Trends, Growth Factors and Opportunities
5.5.4 Internet Of Things: Grographic Segmentation
Chapter 6: Smart Transportation Market by Solutions
6.1 Smart Transportation Market Overview Snapshot and Growth Engine
6.2 Smart Transportation Market Overview
6.3 Ticket Management System
6.3.1 Introduction and Market Overview
6.3.2 Historic and Forecasted Market Size (2016-2028F)
6.3.3 Key Market Trends, Growth Factors and Opportunities
6.3.4 Ticket Management System: Grographic Segmentation
6.4 Parking Management And Guidance System
6.4.1 Introduction and Market Overview
6.4.2 Historic and Forecasted Market Size (2016-2028F)
6.4.3 Key Market Trends, Growth Factors and Opportunities
6.4.4 Parking Management And Guidance System: Grographic Segmentation
6.5 Traffic Management System
6.5.1 Introduction and Market Overview
6.5.2 Historic and Forecasted Market Size (2016-2028F)
6.5.3 Key Market Trends, Growth Factors and Opportunities
6.5.4 Traffic Management System: Grographic Segmentation
6.6 Freight Management
6.6.1 Introduction and Market Overview
6.6.2 Historic and Forecasted Market Size (2016-2028F)
6.6.3 Key Market Trends, Growth Factors and Opportunities
6.6.4 Freight Management: Grographic Segmentation
6.7 Road Safety And Security
6.7.1 Introduction and Market Overview
6.7.2 Historic and Forecasted Market Size (2016-2028F)
6.7.3 Key Market Trends, Growth Factors and Opportunities
6.7.4 Road Safety And Security: Grographic Segmentation
6.8 Others
6.8.1 Introduction and Market Overview
6.8.2 Historic and Forecasted Market Size (2016-2028F)
6.8.3 Key Market Trends, Growth Factors and Opportunities
6.8.4 Others: Grographic Segmentation
Chapter 7: Smart Transportation Market by Application
7.1 Smart Transportation Market Overview Snapshot and Growth Engine
7.2 Smart Transportation Market Overview
7.3 Mobility as a Service
7.3.1 Introduction and Market Overview
7.3.2 Historic and Forecasted Market Size (2016-2028F)
7.3.3 Key Market Trends, Growth Factors and Opportunities
7.3.4 Mobility as a Service: Grographic Segmentation
7.4 Route Information and Route Guidance
7.4.1 Introduction and Market Overview
7.4.2 Historic and Forecasted Market Size (2016-2028F)
7.4.3 Key Market Trends, Growth Factors and Opportunities
7.4.4 Route Information and Route Guidance: Grographic Segmentation
7.5 Public Transport
7.5.1 Introduction and Market Overview
7.5.2 Historic and Forecasted Market Size (2016-2028F)
7.5.3 Key Market Trends, Growth Factors and Opportunities
7.5.4 Public Transport: Grographic Segmentation
7.6 Transit Hubs
7.6.1 Introduction and Market Overview
7.6.2 Historic and Forecasted Market Size (2016-2028F)
7.6.3 Key Market Trends, Growth Factors and Opportunities
7.6.4 Transit Hubs: Grographic Segmentation
7.7 Connected Cars
7.7.1 Introduction and Market Overview
7.7.2 Historic and Forecasted Market Size (2016-2028F)
7.7.3 Key Market Trends, Growth Factors and Opportunities
7.7.4 Connected Cars: Grographic Segmentation
7.8 Video Management
7.8.1 Introduction and Market Overview
7.8.2 Historic and Forecasted Market Size (2016-2028F)
7.8.3 Key Market Trends, Growth Factors and Opportunities
7.8.4 Video Management: Grographic Segmentation
7.9 Others
7.9.1 Introduction and Market Overview
7.9.2 Historic and Forecasted Market Size (2016-2028F)
7.9.3 Key Market Trends, Growth Factors and Opportunities
7.9.4 Others: Grographic Segmentation
Chapter 8: Company Profiles and Competitive Analysis
8.1 Competitive Landscape
8.1.1 Competitive Positioning
8.1.2 Smart Transportation Sales and Market Share By Players
8.1.3 Industry BCG Matrix
8.1.4 Ansoff Matrix
8.1.5 Smart Transportation Industry Concentration Ratio (CR5 and HHI)
8.1.6 Top 5 Smart Transportation Players Market Share
8.1.7 Mergers and Acquisitions
8.1.8 Business Strategies By Top Players
8.2 THALES GROUP (FRANCE)
8.2.1 Company Overview
8.2.2 Key Executives
8.2.3 Company Snapshot
8.2.4 Operating Business Segments
8.2.5 Product Portfolio
8.2.6 Business Performance
8.2.7 Key Strategic Moves and Recent Developments
8.2.8 SWOT Analysis
8.3 HUAWEI TECHNOLOGIES CO. LTD. (CHINA)
8.4 SIEMENS AG (GERMANY)
8.5 IBM CORPORATION (US)
8.6 CISCO SYSTEMS INC. (US)
8.7 SAP (GERMANY)
8.8 CUBIC CORPORATION (US)
8.9 ALSTOM (FRANCE)
8.10 BOMBARDIER INC. (CANADA)
8.11 TOSHIBA (JAPAN)
8.12 HARRIS CORPORATION (US)
8.13 SAAB AB (SWEDEN)
8.14 VESON NAUTICAL (MASSACHUSETTS)
8.15 BASS SOFTWARE (NORWAY)
8.16 BENTLEY SYSTEMS (US)
8.17 INDRA SISTEMAS (SPAIN)
8.18 TRIMBLE (US)
8.19 TOMTOM INTERNATIONAL BV. (NETHERLANDS)
8.20 AMADEUS IT GROUP SA (SPAIN)
8.21 CONDUENT (US)
8.22 KAPSCH (AUSTRIA)
8.23 HITACHI LTD. (JAPAN)
8.24 DESCARTES (CANADA)
8.25 ACCENTURE (IRELAND)
8.26 DNV GL (NORWAY)
Chapter 9: Global Smart Transportation Market Analysis, Insights and Forecast, 2016-2028
9.1 Market Overview
9.2 Historic and Forecasted Market Size By Transportation Mode
9.2.1 Roadways
9.2.2 Railways
9.2.3 Airways
9.2.4 Maritime
9.3 Historic and Forecasted Market Size By Technology Used
9.3.1 Cloud Computing
9.3.2 Artificial Intelligence
9.3.3 Internet Of Things
9.4 Historic and Forecasted Market Size By Solutions
9.4.1 Ticket Management System
9.4.2 Parking Management And Guidance System
9.4.3 Traffic Management System
9.4.4 Freight Management
9.4.5 Road Safety And Security
9.4.6 Others
9.5 Historic and Forecasted Market Size By Application
9.5.1 Mobility as a Service
9.5.2 Route Information and Route Guidance
9.5.3 Public Transport
9.5.4 Transit Hubs
9.5.5 Connected Cars
9.5.6 Video Management
9.5.7 Others
Chapter 10: North America Smart Transportation Market Analysis, Insights and Forecast, 2016-2028
10.1 Key Market Trends, Growth Factors and Opportunities
10.2 Impact of Covid-19
10.3 Key Players
10.4 Key Market Trends, Growth Factors and Opportunities
10.4 Historic and Forecasted Market Size By Transportation Mode
10.4.1 Roadways
10.4.2 Railways
10.4.3 Airways
10.4.4 Maritime
10.5 Historic and Forecasted Market Size By Technology Used
10.5.1 Cloud Computing
10.5.2 Artificial Intelligence
10.5.3 Internet Of Things
10.6 Historic and Forecasted Market Size By Solutions
10.6.1 Ticket Management System
10.6.2 Parking Management And Guidance System
10.6.3 Traffic Management System
10.6.4 Freight Management
10.6.5 Road Safety And Security
10.6.6 Others
10.7 Historic and Forecasted Market Size By Application
10.7.1 Mobility as a Service
10.7.2 Route Information and Route Guidance
10.7.3 Public Transport
10.7.4 Transit Hubs
10.7.5 Connected Cars
10.7.6 Video Management
10.7.7 Others
10.8 Historic and Forecast Market Size by Country
10.8.1 U.S.
10.8.2 Canada
10.8.3 Mexico
Chapter 11: Europe Smart Transportation Market Analysis, Insights and Forecast, 2016-2028
11.1 Key Market Trends, Growth Factors and Opportunities
11.2 Impact of Covid-19
11.3 Key Players
11.4 Key Market Trends, Growth Factors and Opportunities
11.4 Historic and Forecasted Market Size By Transportation Mode
11.4.1 Roadways
11.4.2 Railways
11.4.3 Airways
11.4.4 Maritime
11.5 Historic and Forecasted Market Size By Technology Used
11.5.1 Cloud Computing
11.5.2 Artificial Intelligence
11.5.3 Internet Of Things
11.6 Historic and Forecasted Market Size By Solutions
11.6.1 Ticket Management System
11.6.2 Parking Management And Guidance System
11.6.3 Traffic Management System
11.6.4 Freight Management
11.6.5 Road Safety And Security
11.6.6 Others
11.7 Historic and Forecasted Market Size By Application
11.7.1 Mobility as a Service
11.7.2 Route Information and Route Guidance
11.7.3 Public Transport
11.7.4 Transit Hubs
11.7.5 Connected Cars
11.7.6 Video Management
11.7.7 Others
11.8 Historic and Forecast Market Size by Country
11.8.1 Germany
11.8.2 U.K.
11.8.3 France
11.8.4 Italy
11.8.5 Russia
11.8.6 Spain
Chapter 12: Asia-Pacific Smart Transportation Market Analysis, Insights and Forecast, 2016-2028
12.1 Key Market Trends, Growth Factors and Opportunities
12.2 Impact of Covid-19
12.3 Key Players
12.4 Key Market Trends, Growth Factors and Opportunities
12.4 Historic and Forecasted Market Size By Transportation Mode
12.4.1 Roadways
12.4.2 Railways
12.4.3 Airways
12.4.4 Maritime
12.5 Historic and Forecasted Market Size By Technology Used
12.5.1 Cloud Computing
12.5.2 Artificial Intelligence
12.5.3 Internet Of Things
12.6 Historic and Forecasted Market Size By Solutions
12.6.1 Ticket Management System
12.6.2 Parking Management And Guidance System
12.6.3 Traffic Management System
12.6.4 Freight Management
12.6.5 Road Safety And Security
12.6.6 Others
12.7 Historic and Forecasted Market Size By Application
12.7.1 Mobility as a Service
12.7.2 Route Information and Route Guidance
12.7.3 Public Transport
12.7.4 Transit Hubs
12.7.5 Connected Cars
12.7.6 Video Management
12.7.7 Others
12.8 Historic and Forecast Market Size by Country
12.8.1 China
12.8.2 India
12.8.3 Japan
12.8.4 Southeast Asia
Chapter 13: South America Smart Transportation Market Analysis, Insights and Forecast, 2016-2028
13.1 Key Market Trends, Growth Factors and Opportunities
13.2 Impact of Covid-19
13.3 Key Players
13.4 Key Market Trends, Growth Factors and Opportunities
13.4 Historic and Forecasted Market Size By Transportation Mode
13.4.1 Roadways
13.4.2 Railways
13.4.3 Airways
13.4.4 Maritime
13.5 Historic and Forecasted Market Size By Technology Used
13.5.1 Cloud Computing
13.5.2 Artificial Intelligence
13.5.3 Internet Of Things
13.6 Historic and Forecasted Market Size By Solutions
13.6.1 Ticket Management System
13.6.2 Parking Management And Guidance System
13.6.3 Traffic Management System
13.6.4 Freight Management
13.6.5 Road Safety And Security
13.6.6 Others
13.7 Historic and Forecasted Market Size By Application
13.7.1 Mobility as a Service
13.7.2 Route Information and Route Guidance
13.7.3 Public Transport
13.7.4 Transit Hubs
13.7.5 Connected Cars
13.7.6 Video Management
13.7.7 Others
13.8 Historic and Forecast Market Size by Country
13.8.1 Brazil
13.8.2 Argentina
Chapter 14: Middle East & Africa Smart Transportation Market Analysis, Insights and Forecast, 2016-2028
14.1 Key Market Trends, Growth Factors and Opportunities
14.2 Impact of Covid-19
14.3 Key Players
14.4 Key Market Trends, Growth Factors and Opportunities
14.4 Historic and Forecasted Market Size By Transportation Mode
14.4.1 Roadways
14.4.2 Railways
14.4.3 Airways
14.4.4 Maritime
14.5 Historic and Forecasted Market Size By Technology Used
14.5.1 Cloud Computing
14.5.2 Artificial Intelligence
14.5.3 Internet Of Things
14.6 Historic and Forecasted Market Size By Solutions
14.6.1 Ticket Management System
14.6.2 Parking Management And Guidance System
14.6.3 Traffic Management System
14.6.4 Freight Management
14.6.5 Road Safety And Security
14.6.6 Others
14.7 Historic and Forecasted Market Size By Application
14.7.1 Mobility as a Service
14.7.2 Route Information and Route Guidance
14.7.3 Public Transport
14.7.4 Transit Hubs
14.7.5 Connected Cars
14.7.6 Video Management
14.7.7 Others
14.8 Historic and Forecast Market Size by Country
14.8.1 Saudi Arabia
14.8.2 South Africa
Chapter 15 Investment Analysis
Chapter 16 Analyst Viewpoint and Conclusion
|
Global Smart Transportation Market |
|||
|
Base Year: |
2021 |
Forecast Period: |
2022-2028 |
|
Historical Data : |
2016 to 2020 |
Market Size in 2021: |
USD 95.84 Bn. |
|
Forecast Period 2022-28 CAGR: |
14.09% |
Market Size in 2028: |
USD 241.15 Bn. |
|
Segments Covered: |
By Type |
|
|
|
By Technology Used |
|
||
|
By Solutions |
|
||
|
By Application |
|
||
|
By Region |
|
||
|
Key Market Drivers: |
|
||
|
Key Market Restraints: |
|
||
|
Key Opportunities: |
|
||
|
Companies Covered in the report: |
Thales Group (France), Huawei Technologies Co., Ltd. (China), Siemens AG (Germany), IBM Corporation (US), Cisco Systems, Inc. (US), SAP (Germany), Cubic Corporation (US), Alstom (France), Bombardier Inc. (Canada), Toshiba (Japan) and other major players |
||
LIST OF TABLES
TABLE 001. EXECUTIVE SUMMARY
TABLE 002. SMART TRANSPORTATION MARKET BARGAINING POWER OF SUPPLIERS
TABLE 003. SMART TRANSPORTATION MARKET BARGAINING POWER OF CUSTOMERS
TABLE 004. SMART TRANSPORTATION MARKET COMPETITIVE RIVALRY
TABLE 005. SMART TRANSPORTATION MARKET THREAT OF NEW ENTRANTS
TABLE 006. SMART TRANSPORTATION MARKET THREAT OF SUBSTITUTES
TABLE 007. SMART TRANSPORTATION MARKET BY TRANSPORTATION MODE
TABLE 008. ROADWAYS MARKET OVERVIEW (2016-2028)
TABLE 009. RAILWAYS MARKET OVERVIEW (2016-2028)
TABLE 010. AIRWAYS MARKET OVERVIEW (2016-2028)
TABLE 011. MARITIME MARKET OVERVIEW (2016-2028)
TABLE 012. SMART TRANSPORTATION MARKET BY TECHNOLOGY USED
TABLE 013. CLOUD COMPUTING MARKET OVERVIEW (2016-2028)
TABLE 014. ARTIFICIAL INTELLIGENCE MARKET OVERVIEW (2016-2028)
TABLE 015. INTERNET OF THINGS MARKET OVERVIEW (2016-2028)
TABLE 016. SMART TRANSPORTATION MARKET BY SOLUTIONS
TABLE 017. TICKET MANAGEMENT SYSTEM MARKET OVERVIEW (2016-2028)
TABLE 018. PARKING MANAGEMENT AND GUIDANCE SYSTEM MARKET OVERVIEW (2016-2028)
TABLE 019. TRAFFIC MANAGEMENT SYSTEM MARKET OVERVIEW (2016-2028)
TABLE 020. FREIGHT MANAGEMENT MARKET OVERVIEW (2016-2028)
TABLE 021. ROAD SAFETY AND SECURITY MARKET OVERVIEW (2016-2028)
TABLE 022. OTHERS MARKET OVERVIEW (2016-2028)
TABLE 023. SMART TRANSPORTATION MARKET BY APPLICATION
TABLE 024. MOBILITY AS A SERVICE MARKET OVERVIEW (2016-2028)
TABLE 025. ROUTE INFORMATION AND ROUTE GUIDANCE MARKET OVERVIEW (2016-2028)
TABLE 026. PUBLIC TRANSPORT MARKET OVERVIEW (2016-2028)
TABLE 027. TRANSIT HUBS MARKET OVERVIEW (2016-2028)
TABLE 028. CONNECTED CARS MARKET OVERVIEW (2016-2028)
TABLE 029. VIDEO MANAGEMENT MARKET OVERVIEW (2016-2028)
TABLE 030. OTHERS MARKET OVERVIEW (2016-2028)
TABLE 031. NORTH AMERICA SMART TRANSPORTATION MARKET, BY TRANSPORTATION MODE (2016-2028)
TABLE 032. NORTH AMERICA SMART TRANSPORTATION MARKET, BY TECHNOLOGY USED (2016-2028)
TABLE 033. NORTH AMERICA SMART TRANSPORTATION MARKET, BY SOLUTIONS (2016-2028)
TABLE 034. NORTH AMERICA SMART TRANSPORTATION MARKET, BY APPLICATION (2016-2028)
TABLE 035. N SMART TRANSPORTATION MARKET, BY COUNTRY (2016-2028)
TABLE 036. EUROPE SMART TRANSPORTATION MARKET, BY TRANSPORTATION MODE (2016-2028)
TABLE 037. EUROPE SMART TRANSPORTATION MARKET, BY TECHNOLOGY USED (2016-2028)
TABLE 038. EUROPE SMART TRANSPORTATION MARKET, BY SOLUTIONS (2016-2028)
TABLE 039. EUROPE SMART TRANSPORTATION MARKET, BY APPLICATION (2016-2028)
TABLE 040. SMART TRANSPORTATION MARKET, BY COUNTRY (2016-2028)
TABLE 041. ASIA PACIFIC SMART TRANSPORTATION MARKET, BY TRANSPORTATION MODE (2016-2028)
TABLE 042. ASIA PACIFIC SMART TRANSPORTATION MARKET, BY TECHNOLOGY USED (2016-2028)
TABLE 043. ASIA PACIFIC SMART TRANSPORTATION MARKET, BY SOLUTIONS (2016-2028)
TABLE 044. ASIA PACIFIC SMART TRANSPORTATION MARKET, BY APPLICATION (2016-2028)
TABLE 045. SMART TRANSPORTATION MARKET, BY COUNTRY (2016-2028)
TABLE 046. MIDDLE EAST & AFRICA SMART TRANSPORTATION MARKET, BY TRANSPORTATION MODE (2016-2028)
TABLE 047. MIDDLE EAST & AFRICA SMART TRANSPORTATION MARKET, BY TECHNOLOGY USED (2016-2028)
TABLE 048. MIDDLE EAST & AFRICA SMART TRANSPORTATION MARKET, BY SOLUTIONS (2016-2028)
TABLE 049. MIDDLE EAST & AFRICA SMART TRANSPORTATION MARKET, BY APPLICATION (2016-2028)
TABLE 050. SMART TRANSPORTATION MARKET, BY COUNTRY (2016-2028)
TABLE 051. SOUTH AMERICA SMART TRANSPORTATION MARKET, BY TRANSPORTATION MODE (2016-2028)
TABLE 052. SOUTH AMERICA SMART TRANSPORTATION MARKET, BY TECHNOLOGY USED (2016-2028)
TABLE 053. SOUTH AMERICA SMART TRANSPORTATION MARKET, BY SOLUTIONS (2016-2028)
TABLE 054. SOUTH AMERICA SMART TRANSPORTATION MARKET, BY APPLICATION (2016-2028)
TABLE 055. SMART TRANSPORTATION MARKET, BY COUNTRY (2016-2028)
TABLE 056. THALES GROUP (FRANCE): SNAPSHOT
TABLE 057. THALES GROUP (FRANCE): BUSINESS PERFORMANCE
TABLE 058. THALES GROUP (FRANCE): PRODUCT PORTFOLIO
TABLE 059. THALES GROUP (FRANCE): KEY STRATEGIC MOVES AND DEVELOPMENTS
TABLE 059. HUAWEI TECHNOLOGIES CO. LTD. (CHINA): SNAPSHOT
TABLE 060. HUAWEI TECHNOLOGIES CO. LTD. (CHINA): BUSINESS PERFORMANCE
TABLE 061. HUAWEI TECHNOLOGIES CO. LTD. (CHINA): PRODUCT PORTFOLIO
TABLE 062. HUAWEI TECHNOLOGIES CO. LTD. (CHINA): KEY STRATEGIC MOVES AND DEVELOPMENTS
TABLE 062. SIEMENS AG (GERMANY): SNAPSHOT
TABLE 063. SIEMENS AG (GERMANY): BUSINESS PERFORMANCE
TABLE 064. SIEMENS AG (GERMANY): PRODUCT PORTFOLIO
TABLE 065. SIEMENS AG (GERMANY): KEY STRATEGIC MOVES AND DEVELOPMENTS
TABLE 065. IBM CORPORATION (US): SNAPSHOT
TABLE 066. IBM CORPORATION (US): BUSINESS PERFORMANCE
TABLE 067. IBM CORPORATION (US): PRODUCT PORTFOLIO
TABLE 068. IBM CORPORATION (US): KEY STRATEGIC MOVES AND DEVELOPMENTS
TABLE 068. CISCO SYSTEMS INC. (US): SNAPSHOT
TABLE 069. CISCO SYSTEMS INC. (US): BUSINESS PERFORMANCE
TABLE 070. CISCO SYSTEMS INC. (US): PRODUCT PORTFOLIO
TABLE 071. CISCO SYSTEMS INC. (US): KEY STRATEGIC MOVES AND DEVELOPMENTS
TABLE 071. SAP (GERMANY): SNAPSHOT
TABLE 072. SAP (GERMANY): BUSINESS PERFORMANCE
TABLE 073. SAP (GERMANY): PRODUCT PORTFOLIO
TABLE 074. SAP (GERMANY): KEY STRATEGIC MOVES AND DEVELOPMENTS
TABLE 074. CUBIC CORPORATION (US): SNAPSHOT
TABLE 075. CUBIC CORPORATION (US): BUSINESS PERFORMANCE
TABLE 076. CUBIC CORPORATION (US): PRODUCT PORTFOLIO
TABLE 077. CUBIC CORPORATION (US): KEY STRATEGIC MOVES AND DEVELOPMENTS
TABLE 077. ALSTOM (FRANCE): SNAPSHOT
TABLE 078. ALSTOM (FRANCE): BUSINESS PERFORMANCE
TABLE 079. ALSTOM (FRANCE): PRODUCT PORTFOLIO
TABLE 080. ALSTOM (FRANCE): KEY STRATEGIC MOVES AND DEVELOPMENTS
TABLE 080. BOMBARDIER INC. (CANADA): SNAPSHOT
TABLE 081. BOMBARDIER INC. (CANADA): BUSINESS PERFORMANCE
TABLE 082. BOMBARDIER INC. (CANADA): PRODUCT PORTFOLIO
TABLE 083. BOMBARDIER INC. (CANADA): KEY STRATEGIC MOVES AND DEVELOPMENTS
TABLE 083. TOSHIBA (JAPAN): SNAPSHOT
TABLE 084. TOSHIBA (JAPAN): BUSINESS PERFORMANCE
TABLE 085. TOSHIBA (JAPAN): PRODUCT PORTFOLIO
TABLE 086. TOSHIBA (JAPAN): KEY STRATEGIC MOVES AND DEVELOPMENTS
TABLE 086. HARRIS CORPORATION (US): SNAPSHOT
TABLE 087. HARRIS CORPORATION (US): BUSINESS PERFORMANCE
TABLE 088. HARRIS CORPORATION (US): PRODUCT PORTFOLIO
TABLE 089. HARRIS CORPORATION (US): KEY STRATEGIC MOVES AND DEVELOPMENTS
TABLE 089. SAAB AB (SWEDEN): SNAPSHOT
TABLE 090. SAAB AB (SWEDEN): BUSINESS PERFORMANCE
TABLE 091. SAAB AB (SWEDEN): PRODUCT PORTFOLIO
TABLE 092. SAAB AB (SWEDEN): KEY STRATEGIC MOVES AND DEVELOPMENTS
TABLE 092. VESON NAUTICAL (MASSACHUSETTS): SNAPSHOT
TABLE 093. VESON NAUTICAL (MASSACHUSETTS): BUSINESS PERFORMANCE
TABLE 094. VESON NAUTICAL (MASSACHUSETTS): PRODUCT PORTFOLIO
TABLE 095. VESON NAUTICAL (MASSACHUSETTS): KEY STRATEGIC MOVES AND DEVELOPMENTS
TABLE 095. BASS SOFTWARE (NORWAY): SNAPSHOT
TABLE 096. BASS SOFTWARE (NORWAY): BUSINESS PERFORMANCE
TABLE 097. BASS SOFTWARE (NORWAY): PRODUCT PORTFOLIO
TABLE 098. BASS SOFTWARE (NORWAY): KEY STRATEGIC MOVES AND DEVELOPMENTS
TABLE 098. BENTLEY SYSTEMS (US): SNAPSHOT
TABLE 099. BENTLEY SYSTEMS (US): BUSINESS PERFORMANCE
TABLE 100. BENTLEY SYSTEMS (US): PRODUCT PORTFOLIO
TABLE 101. BENTLEY SYSTEMS (US): KEY STRATEGIC MOVES AND DEVELOPMENTS
TABLE 101. INDRA SISTEMAS (SPAIN): SNAPSHOT
TABLE 102. INDRA SISTEMAS (SPAIN): BUSINESS PERFORMANCE
TABLE 103. INDRA SISTEMAS (SPAIN): PRODUCT PORTFOLIO
TABLE 104. INDRA SISTEMAS (SPAIN): KEY STRATEGIC MOVES AND DEVELOPMENTS
TABLE 104. TRIMBLE (US): SNAPSHOT
TABLE 105. TRIMBLE (US): BUSINESS PERFORMANCE
TABLE 106. TRIMBLE (US): PRODUCT PORTFOLIO
TABLE 107. TRIMBLE (US): KEY STRATEGIC MOVES AND DEVELOPMENTS
TABLE 107. TOMTOM INTERNATIONAL BV. (NETHERLANDS): SNAPSHOT
TABLE 108. TOMTOM INTERNATIONAL BV. (NETHERLANDS): BUSINESS PERFORMANCE
TABLE 109. TOMTOM INTERNATIONAL BV. (NETHERLANDS): PRODUCT PORTFOLIO
TABLE 110. TOMTOM INTERNATIONAL BV. (NETHERLANDS): KEY STRATEGIC MOVES AND DEVELOPMENTS
TABLE 110. AMADEUS IT GROUP SA (SPAIN): SNAPSHOT
TABLE 111. AMADEUS IT GROUP SA (SPAIN): BUSINESS PERFORMANCE
TABLE 112. AMADEUS IT GROUP SA (SPAIN): PRODUCT PORTFOLIO
TABLE 113. AMADEUS IT GROUP SA (SPAIN): KEY STRATEGIC MOVES AND DEVELOPMENTS
TABLE 113. CONDUENT (US): SNAPSHOT
TABLE 114. CONDUENT (US): BUSINESS PERFORMANCE
TABLE 115. CONDUENT (US): PRODUCT PORTFOLIO
TABLE 116. CONDUENT (US): KEY STRATEGIC MOVES AND DEVELOPMENTS
TABLE 116. KAPSCH (AUSTRIA): SNAPSHOT
TABLE 117. KAPSCH (AUSTRIA): BUSINESS PERFORMANCE
TABLE 118. KAPSCH (AUSTRIA): PRODUCT PORTFOLIO
TABLE 119. KAPSCH (AUSTRIA): KEY STRATEGIC MOVES AND DEVELOPMENTS
TABLE 119. HITACHI LTD. (JAPAN): SNAPSHOT
TABLE 120. HITACHI LTD. (JAPAN): BUSINESS PERFORMANCE
TABLE 121. HITACHI LTD. (JAPAN): PRODUCT PORTFOLIO
TABLE 122. HITACHI LTD. (JAPAN): KEY STRATEGIC MOVES AND DEVELOPMENTS
TABLE 122. DESCARTES (CANADA): SNAPSHOT
TABLE 123. DESCARTES (CANADA): BUSINESS PERFORMANCE
TABLE 124. DESCARTES (CANADA): PRODUCT PORTFOLIO
TABLE 125. DESCARTES (CANADA): KEY STRATEGIC MOVES AND DEVELOPMENTS
TABLE 125. ACCENTURE (IRELAND): SNAPSHOT
TABLE 126. ACCENTURE (IRELAND): BUSINESS PERFORMANCE
TABLE 127. ACCENTURE (IRELAND): PRODUCT PORTFOLIO
TABLE 128. ACCENTURE (IRELAND): KEY STRATEGIC MOVES AND DEVELOPMENTS
TABLE 128. DNV GL (NORWAY): SNAPSHOT
TABLE 129. DNV GL (NORWAY): BUSINESS PERFORMANCE
TABLE 130. DNV GL (NORWAY): PRODUCT PORTFOLIO
TABLE 131. DNV GL (NORWAY): KEY STRATEGIC MOVES AND DEVELOPMENTS
LIST OF FIGURES
FIGURE 001. YEARS CONSIDERED FOR ANALYSIS
FIGURE 002. SCOPE OF THE STUDY
FIGURE 003. SMART TRANSPORTATION MARKET OVERVIEW BY REGIONS
FIGURE 004. PORTER'S FIVE FORCES ANALYSIS
FIGURE 005. BARGAINING POWER OF SUPPLIERS
FIGURE 006. COMPETITIVE RIVALRYFIGURE 007. THREAT OF NEW ENTRANTS
FIGURE 008. THREAT OF SUBSTITUTES
FIGURE 009. VALUE CHAIN ANALYSIS
FIGURE 010. PESTLE ANALYSIS
FIGURE 011. SMART TRANSPORTATION MARKET OVERVIEW BY TRANSPORTATION MODE
FIGURE 012. ROADWAYS MARKET OVERVIEW (2016-2028)
FIGURE 013. RAILWAYS MARKET OVERVIEW (2016-2028)
FIGURE 014. AIRWAYS MARKET OVERVIEW (2016-2028)
FIGURE 015. MARITIME MARKET OVERVIEW (2016-2028)
FIGURE 016. SMART TRANSPORTATION MARKET OVERVIEW BY TECHNOLOGY USED
FIGURE 017. CLOUD COMPUTING MARKET OVERVIEW (2016-2028)
FIGURE 018. ARTIFICIAL INTELLIGENCE MARKET OVERVIEW (2016-2028)
FIGURE 019. INTERNET OF THINGS MARKET OVERVIEW (2016-2028)
FIGURE 020. SMART TRANSPORTATION MARKET OVERVIEW BY SOLUTIONS
FIGURE 021. TICKET MANAGEMENT SYSTEM MARKET OVERVIEW (2016-2028)
FIGURE 022. PARKING MANAGEMENT AND GUIDANCE SYSTEM MARKET OVERVIEW (2016-2028)
FIGURE 023. TRAFFIC MANAGEMENT SYSTEM MARKET OVERVIEW (2016-2028)
FIGURE 024. FREIGHT MANAGEMENT MARKET OVERVIEW (2016-2028)
FIGURE 025. ROAD SAFETY AND SECURITY MARKET OVERVIEW (2016-2028)
FIGURE 026. OTHERS MARKET OVERVIEW (2016-2028)
FIGURE 027. SMART TRANSPORTATION MARKET OVERVIEW BY APPLICATION
FIGURE 028. MOBILITY AS A SERVICE MARKET OVERVIEW (2016-2028)
FIGURE 029. ROUTE INFORMATION AND ROUTE GUIDANCE MARKET OVERVIEW (2016-2028)
FIGURE 030. PUBLIC TRANSPORT MARKET OVERVIEW (2016-2028)
FIGURE 031. TRANSIT HUBS MARKET OVERVIEW (2016-2028)
FIGURE 032. CONNECTED CARS MARKET OVERVIEW (2016-2028)
FIGURE 033. VIDEO MANAGEMENT MARKET OVERVIEW (2016-2028)
FIGURE 034. OTHERS MARKET OVERVIEW (2016-2028)
FIGURE 035. NORTH AMERICA SMART TRANSPORTATION MARKET OVERVIEW BY COUNTRY (2016-2028)
FIGURE 036. EUROPE SMART TRANSPORTATION MARKET OVERVIEW BY COUNTRY (2016-2028)
FIGURE 037. ASIA PACIFIC SMART TRANSPORTATION MARKET OVERVIEW BY COUNTRY (2016-2028)
FIGURE 038. MIDDLE EAST & AFRICA SMART TRANSPORTATION MARKET OVERVIEW BY COUNTRY (2016-2028)
FIGURE 039. SOUTH AMERICA SMART TRANSPORTATION MARKET OVERVIEW BY COUNTRY (2016-2028)
Frequently Asked Questions :
The forecast period in the Smart Transportation Market research report is 2022-2028.
The key players mentioned are Thales Group (France), Huawei Technologies Co., Ltd. (China), Siemens AG (Germany), IBM Corporation (US), Cisco Systems, Inc. (US), SAP (Germany), Cubic Corporation (US), Alstom (France), Bombardier Inc. (Canada), Toshiba (Japan), Harris Corporation (US), Saab AB (Sweden), Veson Nautical (Massachusetts), BASS Software (Norway), Bentley Systems (US), Indra Sistemas (Spain), Trimble (US), TomTom International BV. (Netherlands), Amadeus IT Group SA (Spain), Conduent (US), Kapsch (Austria), Hitachi Ltd. (Japan), Descartes (Canada), Accenture (Ireland), and DNV GL (Norway).
The Smart Transportation market is segmented into Transportation Mode, Technology Used, Solutions and Region. By Application, the market is categorized into Mobility as a Service, Route Information and Route Guidance, Public Transport, Transit Hubs, Connected Cars, Video Management, Others. By Transportation Mode, it is classified into Roadways, Railways, Airways, and Maritime and others. By Solution, it is classified into Ticket Management System, Parking Management And Guidance System, Traffic Management System, Freight Management, Road Safety And Security, And Others. By region, it is analysed across North America (U.S.; Canada; Mexico), Europe (Germany; U.K.; France; Italy; Russia; Spain etc.), Asia-Pacific (China; India; Japan; Southeast Asia etc.), South America (Brazil; Argentina etc.), Middle East & Africa (Saudi Arabia; South Africa etc.).
Smart Transportation Systems uses a wide range of technologies such as traffic signal control systems, automatic number plate recognition, container management systems, or speed cameras such as security CCTV systems to evaluate, manage, and monitor transportation systems to improve efficiency and safety in transportation services.
The Smart Transportation Market was estimated at USD 95.84 billion in 2021 and is anticipated to reach USD 241.15 billion by 2028, growing at a CAGR of 14.09% globally.


