


Power Plant Services Market Overview
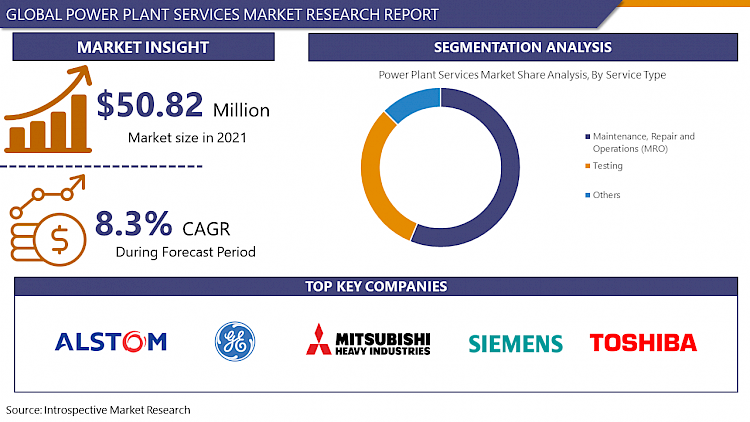
The Global Power Plant Services market was estimated at USD 50.82 million in 2021, and is anticipated to reach USD 88.81 million by 2028, growing at a CAGR of 8.3%.
Suppliers of power plant services include services to power plants in the post-commissioning phase. Plant operators can handle operational risks such as infrastructure, planning, and supply chain activities with the aid of power plant services. The services enable operators to concentrate more on their primary business goals. Operators of power plants around the world are increasingly able to recruit service providers to perform repairs and other activities at their facilities. The market for power plant services is largely driven by increasing energy demand as well as the current state of power-generating equipment.
Power Plant Services facilities that are dilapidated and aged create major opportunities for power replacement and re- Power plant services aimed at improving overall performance and meeting strict emission standards. Furthermore, to meet the increasing electricity demand, several power generating plants are being run beyond their scheduled operations. Third-party service providers, as well as original equipment suppliers, can benefit indirectly as a result of this (OEMs). Routine maintenance and service jobs, especially for gas turbines, steam turbines, and boilers, are in high demand, as are strict environmental rules and regulations.
Power Plant Services Market Dynamics
Several factors are driving the growth of the power plant services industry. The power plant services market is rapidly expanding as new generating capacities are added to plants to meet growing electricity demand. Certain impediments, on the other hand, significantly slow the market's momentum and development. The lack of skilled labor, the increased bargaining power of major utilities, the inefficiency of the current system, and the lack of private investors are all major factors that restrict business growth. The demand for Power plant services purchase agreements has increased and continues to improve. The market in developed and emerging economies is driven by the need to replace old power infrastructure.
The components in a power plant are rarely damaged and replaced, and the demand is being powered by OEM investments. Power plant services are increasingly expanding as electricity demand increases year after year. Renewable power plants are in high demand as governments aim to meet global energy demand through clean energy production to minimize carbon emissions. The ability of major utilities to sign long-term service agreements for their newly constructed power plants would also help Power plant service providers. Power plant service providers would benefit from extensive maintenance and upgrades to aging power plants to maximize usage.
Market Segmentation
Players Covered in Power Plant Services market are :
There are a lot of players in the global power plant services market. Several businesses are dependent on power plant facilities to keep customers supplied during any stationary unit outages. Although outsourcing non-core operations allows plant operators to concentrate on their core competencies, third-party services providers can have the added benefit of reduced service risks by providing a fixed-price contract for an extended period.
- Alstom
- GE
- Mitsubishi Heavy Industries
- Siemens
- TNB Remaco
- Gujarat Industries Power
- PPSVCS
- Transfield Services
- Toshiba
- Vasavi Power Service
- WorleyParsons and other major players.
Regional Outlook of Power Plant Services Market
The United States is the largest market in this category, and it is expected to remain so until 2030, owing to the country's large number of old and maintenance-intensive power plants. According to a recent market research study on power plant services, Asia-Pacific dominates the global power plant services market. The area is also home to the world's fastest-growing demand for power plant MRO services. The power plant services market in Asia-Pacific continues to soar, driven by robust growth in electricity demand and rapid capacity expansions in the power sector.
Furthermore, the Chinese power industry has become highly competitive as a result of the growth of independent power producers (IPPS), which will drive the power plant services market. The rapid expansion of renewable power plant capacity in Europe will be followed by an increase in the demand for related power plant services.
|
Global Power Plant Services Market |
|||
|
Base Year: |
2021 |
Forecast Period: |
2022-2028 |
|
Historical Data: |
2016 to 2020 |
Market Size in 2021: |
USD 50.82 Mn. |
|
Forecast Period 2022-28 CAGR: |
8.3% |
Market Size in 2028: |
USD 88.81 Mn. |
|
Segments Covered: |
By Service Type |
|
|
|
By Application |
|
||
|
By Region |
|
||
|
Key Market Drivers: |
|
||
|
Key Market Restraints: |
|
||
|
Key Opportunities: |
|
||
|
Companies Covered in the report: |
|
||
Chapter 1: Introduction
1.1 Research Objectives
1.2 Research Methodology
1.3 Research Process
1.4 Scope and Coverage
1.4.1 Market Definition
1.4.2 Key Questions Answered
1.5 Market Segmentation
Chapter 2:Executive Summary
Chapter 3:Growth Opportunities By Segment
3.1 By Type
3.2 By Application
Chapter 4: Market Landscape
4.1 Porter's Five Forces Analysis
4.1.1 Bargaining Power of Supplier
4.1.2 Threat of New Entrants
4.1.3 Threat of Substitutes
4.1.4 Competitive Rivalry
4.1.5 Bargaining Power Among Buyers
4.2 Industry Value Chain Analysis
4.3 Market Dynamics
4.3.1 Drivers
4.3.2 Restraints
4.3.3 Opportunities
4.5.4 Challenges
4.4 Pestle Analysis
4.5 Technological Roadmap
4.6 Regulatory Landscape
4.7 SWOT Analysis
4.8 Price Trend Analysis
4.9 Patent Analysis
4.10 Analysis of the Impact of Covid-19
4.10.1 Impact on the Overall Market
4.10.2 Impact on the Supply Chain
4.10.3 Impact on the Key Manufacturers
4.10.4 Impact on the Pricing
Chapter 5: Power Plant Services Market by Type
5.1 Power Plant Services Market Overview Snapshot and Growth Engine
5.2 Power Plant Services Market Overview
5.3 Maintenance
5.3.1 Introduction and Market Overview
5.3.2 Historic and Forecasted Market Size (2016-2028F)
5.3.3 Key Market Trends, Growth Factors and Opportunities
5.3.4 Maintenance: Grographic Segmentation
5.4 Repair & Operations {MRO}
5.4.1 Introduction and Market Overview
5.4.2 Historic and Forecasted Market Size (2016-2028F)
5.4.3 Key Market Trends, Growth Factors and Opportunities
5.4.4 Repair & Operations {MRO}: Grographic Segmentation
5.5 Testing
5.5.1 Introduction and Market Overview
5.5.2 Historic and Forecasted Market Size (2016-2028F)
5.5.3 Key Market Trends, Growth Factors and Opportunities
5.5.4 Testing: Grographic Segmentation
5.6 Others
5.6.1 Introduction and Market Overview
5.6.2 Historic and Forecasted Market Size (2016-2028F)
5.6.3 Key Market Trends, Growth Factors and Opportunities
5.6.4 Others: Grographic Segmentation
Chapter 6: Power Plant Services Market by Application
6.1 Power Plant Services Market Overview Snapshot and Growth Engine
6.2 Power Plant Services Market Overview
6.3 State-Owned Enterprises
6.3.1 Introduction and Market Overview
6.3.2 Historic and Forecasted Market Size (2016-2028F)
6.3.3 Key Market Trends, Growth Factors and Opportunities
6.3.4 State-Owned Enterprises: Grographic Segmentation
6.4 Private Enterprises
6.4.1 Introduction and Market Overview
6.4.2 Historic and Forecasted Market Size (2016-2028F)
6.4.3 Key Market Trends, Growth Factors and Opportunities
6.4.4 Private Enterprises: Grographic Segmentation
Chapter 7: Company Profiles and Competitive Analysis
7.1 Competitive Landscape
7.1.1 Competitive Positioning
7.1.2 Power Plant Services Sales and Market Share By Players
7.1.3 Industry BCG Matrix
7.1.4 Ansoff Matrix
7.1.5 Power Plant Services Industry Concentration Ratio (CR5 and HHI)
7.1.6 Top 5 Power Plant Services Players Market Share
7.1.7 Mergers and Acquisitions
7.1.8 Business Strategies By Top Players
7.2 ALSTOM
7.2.1 Company Overview
7.2.2 Key Executives
7.2.3 Company Snapshot
7.2.4 Operating Business Segments
7.2.5 Product Portfolio
7.2.6 Business Performance
7.2.7 Key Strategic Moves and Recent Developments
7.2.8 SWOT Analysis
7.3 GE
7.4 MITSUBISHI HEAVY INDUSTRIES
7.5 SIEMENS
7.6 TNB REMACO
7.7 GUJARAT INDUSTRIES POWER
7.8 PPSVCS
7.9 TRANSFIELD SERVICES
7.10 TOSHIBA
7.11 VASAVI POWER SERVICE
7.12 WORLEYPARSONS
7.13 OTHER MAJOR PLAYERS
Chapter 8: Global Power Plant Services Market Analysis, Insights and Forecast, 2016-2028
8.1 Market Overview
8.2 Historic and Forecasted Market Size By Type
8.2.1 Maintenance
8.2.2 Repair & Operations {MRO}
8.2.3 Testing
8.2.4 Others
8.3 Historic and Forecasted Market Size By Application
8.3.1 State-Owned Enterprises
8.3.2 Private Enterprises
Chapter 9: North America Power Plant Services Market Analysis, Insights and Forecast, 2016-2028
9.1 Key Market Trends, Growth Factors and Opportunities
9.2 Impact of Covid-19
9.3 Key Players
9.4 Key Market Trends, Growth Factors and Opportunities
9.4 Historic and Forecasted Market Size By Type
9.4.1 Maintenance
9.4.2 Repair & Operations {MRO}
9.4.3 Testing
9.4.4 Others
9.5 Historic and Forecasted Market Size By Application
9.5.1 State-Owned Enterprises
9.5.2 Private Enterprises
9.6 Historic and Forecast Market Size by Country
9.6.1 U.S.
9.6.2 Canada
9.6.3 Mexico
Chapter 10: Europe Power Plant Services Market Analysis, Insights and Forecast, 2016-2028
10.1 Key Market Trends, Growth Factors and Opportunities
10.2 Impact of Covid-19
10.3 Key Players
10.4 Key Market Trends, Growth Factors and Opportunities
10.4 Historic and Forecasted Market Size By Type
10.4.1 Maintenance
10.4.2 Repair & Operations {MRO}
10.4.3 Testing
10.4.4 Others
10.5 Historic and Forecasted Market Size By Application
10.5.1 State-Owned Enterprises
10.5.2 Private Enterprises
10.6 Historic and Forecast Market Size by Country
10.6.1 Germany
10.6.2 U.K.
10.6.3 France
10.6.4 Italy
10.6.5 Russia
10.6.6 Spain
10.6.7 Rest of Europe
Chapter 11: Asia-Pacific Power Plant Services Market Analysis, Insights and Forecast, 2016-2028
11.1 Key Market Trends, Growth Factors and Opportunities
11.2 Impact of Covid-19
11.3 Key Players
11.4 Key Market Trends, Growth Factors and Opportunities
11.4 Historic and Forecasted Market Size By Type
11.4.1 Maintenance
11.4.2 Repair & Operations {MRO}
11.4.3 Testing
11.4.4 Others
11.5 Historic and Forecasted Market Size By Application
11.5.1 State-Owned Enterprises
11.5.2 Private Enterprises
11.6 Historic and Forecast Market Size by Country
11.6.1 China
11.6.2 India
11.6.3 Japan
11.6.4 Singapore
11.6.5 Australia
11.6.6 New Zealand
11.6.7 Rest of APAC
Chapter 12: Middle East & Africa Power Plant Services Market Analysis, Insights and Forecast, 2016-2028
12.1 Key Market Trends, Growth Factors and Opportunities
12.2 Impact of Covid-19
12.3 Key Players
12.4 Key Market Trends, Growth Factors and Opportunities
12.4 Historic and Forecasted Market Size By Type
12.4.1 Maintenance
12.4.2 Repair & Operations {MRO}
12.4.3 Testing
12.4.4 Others
12.5 Historic and Forecasted Market Size By Application
12.5.1 State-Owned Enterprises
12.5.2 Private Enterprises
12.6 Historic and Forecast Market Size by Country
12.6.1 Turkey
12.6.2 Saudi Arabia
12.6.3 Iran
12.6.4 UAE
12.6.5 Africa
12.6.6 Rest of MEA
Chapter 13: South America Power Plant Services Market Analysis, Insights and Forecast, 2016-2028
13.1 Key Market Trends, Growth Factors and Opportunities
13.2 Impact of Covid-19
13.3 Key Players
13.4 Key Market Trends, Growth Factors and Opportunities
13.4 Historic and Forecasted Market Size By Type
13.4.1 Maintenance
13.4.2 Repair & Operations {MRO}
13.4.3 Testing
13.4.4 Others
13.5 Historic and Forecasted Market Size By Application
13.5.1 State-Owned Enterprises
13.5.2 Private Enterprises
13.6 Historic and Forecast Market Size by Country
13.6.1 Brazil
13.6.2 Argentina
13.6.3 Rest of SA
Chapter 14 Investment Analysis
Chapter 15 Analyst Viewpoint and Conclusion
|
Global Power Plant Services Market |
|||
|
Base Year: |
2021 |
Forecast Period: |
2022-2028 |
|
Historical Data: |
2016 to 2020 |
Market Size in 2021: |
USD 50.82 Mn. |
|
Forecast Period 2022-28 CAGR: |
8.3% |
Market Size in 2028: |
USD 88.81 Mn. |
|
Segments Covered: |
By Service Type |
|
|
|
By Application |
|
||
|
By Region |
|
||
|
Key Market Drivers: |
|
||
|
Key Market Restraints: |
|
||
|
Key Opportunities: |
|
||
|
Companies Covered in the report: |
|
||
LIST OF TABLES
TABLE 001. EXECUTIVE SUMMARY
TABLE 002. POWER PLANT SERVICES MARKET BARGAINING POWER OF SUPPLIERS
TABLE 003. POWER PLANT SERVICES MARKET BARGAINING POWER OF CUSTOMERS
TABLE 004. POWER PLANT SERVICES MARKET COMPETITIVE RIVALRY
TABLE 005. POWER PLANT SERVICES MARKET THREAT OF NEW ENTRANTS
TABLE 006. POWER PLANT SERVICES MARKET THREAT OF SUBSTITUTES
TABLE 007. POWER PLANT SERVICES MARKET BY TYPE
TABLE 008. MAINTENANCE MARKET OVERVIEW (2016-2028)
TABLE 009. REPAIR & OPERATIONS {MRO} MARKET OVERVIEW (2016-2028)
TABLE 010. TESTING MARKET OVERVIEW (2016-2028)
TABLE 011. OTHERS MARKET OVERVIEW (2016-2028)
TABLE 012. POWER PLANT SERVICES MARKET BY APPLICATION
TABLE 013. STATE-OWNED ENTERPRISES MARKET OVERVIEW (2016-2028)
TABLE 014. PRIVATE ENTERPRISES MARKET OVERVIEW (2016-2028)
TABLE 015. NORTH AMERICA POWER PLANT SERVICES MARKET, BY TYPE (2016-2028)
TABLE 016. NORTH AMERICA POWER PLANT SERVICES MARKET, BY APPLICATION (2016-2028)
TABLE 017. N POWER PLANT SERVICES MARKET, BY COUNTRY (2016-2028)
TABLE 018. EUROPE POWER PLANT SERVICES MARKET, BY TYPE (2016-2028)
TABLE 019. EUROPE POWER PLANT SERVICES MARKET, BY APPLICATION (2016-2028)
TABLE 020. POWER PLANT SERVICES MARKET, BY COUNTRY (2016-2028)
TABLE 021. ASIA PACIFIC POWER PLANT SERVICES MARKET, BY TYPE (2016-2028)
TABLE 022. ASIA PACIFIC POWER PLANT SERVICES MARKET, BY APPLICATION (2016-2028)
TABLE 023. POWER PLANT SERVICES MARKET, BY COUNTRY (2016-2028)
TABLE 024. MIDDLE EAST & AFRICA POWER PLANT SERVICES MARKET, BY TYPE (2016-2028)
TABLE 025. MIDDLE EAST & AFRICA POWER PLANT SERVICES MARKET, BY APPLICATION (2016-2028)
TABLE 026. POWER PLANT SERVICES MARKET, BY COUNTRY (2016-2028)
TABLE 027. SOUTH AMERICA POWER PLANT SERVICES MARKET, BY TYPE (2016-2028)
TABLE 028. SOUTH AMERICA POWER PLANT SERVICES MARKET, BY APPLICATION (2016-2028)
TABLE 029. POWER PLANT SERVICES MARKET, BY COUNTRY (2016-2028)
TABLE 030. ALSTOM: SNAPSHOT
TABLE 031. ALSTOM: BUSINESS PERFORMANCE
TABLE 032. ALSTOM: PRODUCT PORTFOLIO
TABLE 033. ALSTOM: KEY STRATEGIC MOVES AND DEVELOPMENTS
TABLE 033. GE: SNAPSHOT
TABLE 034. GE: BUSINESS PERFORMANCE
TABLE 035. GE: PRODUCT PORTFOLIO
TABLE 036. GE: KEY STRATEGIC MOVES AND DEVELOPMENTS
TABLE 036. MITSUBISHI HEAVY INDUSTRIES: SNAPSHOT
TABLE 037. MITSUBISHI HEAVY INDUSTRIES: BUSINESS PERFORMANCE
TABLE 038. MITSUBISHI HEAVY INDUSTRIES: PRODUCT PORTFOLIO
TABLE 039. MITSUBISHI HEAVY INDUSTRIES: KEY STRATEGIC MOVES AND DEVELOPMENTS
TABLE 039. SIEMENS: SNAPSHOT
TABLE 040. SIEMENS: BUSINESS PERFORMANCE
TABLE 041. SIEMENS: PRODUCT PORTFOLIO
TABLE 042. SIEMENS: KEY STRATEGIC MOVES AND DEVELOPMENTS
TABLE 042. TNB REMACO: SNAPSHOT
TABLE 043. TNB REMACO: BUSINESS PERFORMANCE
TABLE 044. TNB REMACO: PRODUCT PORTFOLIO
TABLE 045. TNB REMACO: KEY STRATEGIC MOVES AND DEVELOPMENTS
TABLE 045. GUJARAT INDUSTRIES POWER: SNAPSHOT
TABLE 046. GUJARAT INDUSTRIES POWER: BUSINESS PERFORMANCE
TABLE 047. GUJARAT INDUSTRIES POWER: PRODUCT PORTFOLIO
TABLE 048. GUJARAT INDUSTRIES POWER: KEY STRATEGIC MOVES AND DEVELOPMENTS
TABLE 048. PPSVCS: SNAPSHOT
TABLE 049. PPSVCS: BUSINESS PERFORMANCE
TABLE 050. PPSVCS: PRODUCT PORTFOLIO
TABLE 051. PPSVCS: KEY STRATEGIC MOVES AND DEVELOPMENTS
TABLE 051. TRANSFIELD SERVICES: SNAPSHOT
TABLE 052. TRANSFIELD SERVICES: BUSINESS PERFORMANCE
TABLE 053. TRANSFIELD SERVICES: PRODUCT PORTFOLIO
TABLE 054. TRANSFIELD SERVICES: KEY STRATEGIC MOVES AND DEVELOPMENTS
TABLE 054. TOSHIBA: SNAPSHOT
TABLE 055. TOSHIBA: BUSINESS PERFORMANCE
TABLE 056. TOSHIBA: PRODUCT PORTFOLIO
TABLE 057. TOSHIBA: KEY STRATEGIC MOVES AND DEVELOPMENTS
TABLE 057. VASAVI POWER SERVICE: SNAPSHOT
TABLE 058. VASAVI POWER SERVICE: BUSINESS PERFORMANCE
TABLE 059. VASAVI POWER SERVICE: PRODUCT PORTFOLIO
TABLE 060. VASAVI POWER SERVICE: KEY STRATEGIC MOVES AND DEVELOPMENTS
TABLE 060. WORLEYPARSONS: SNAPSHOT
TABLE 061. WORLEYPARSONS: BUSINESS PERFORMANCE
TABLE 062. WORLEYPARSONS: PRODUCT PORTFOLIO
TABLE 063. WORLEYPARSONS: KEY STRATEGIC MOVES AND DEVELOPMENTS
TABLE 063. OTHER MAJOR PLAYERS: SNAPSHOT
TABLE 064. OTHER MAJOR PLAYERS: BUSINESS PERFORMANCE
TABLE 065. OTHER MAJOR PLAYERS: PRODUCT PORTFOLIO
TABLE 066. OTHER MAJOR PLAYERS: KEY STRATEGIC MOVES AND DEVELOPMENTS
LIST OF FIGURES
FIGURE 001. YEARS CONSIDERED FOR ANALYSIS
FIGURE 002. SCOPE OF THE STUDY
FIGURE 003. POWER PLANT SERVICES MARKET OVERVIEW BY REGIONS
FIGURE 004. PORTER'S FIVE FORCES ANALYSIS
FIGURE 005. BARGAINING POWER OF SUPPLIERS
FIGURE 006. COMPETITIVE RIVALRYFIGURE 007. THREAT OF NEW ENTRANTS
FIGURE 008. THREAT OF SUBSTITUTES
FIGURE 009. VALUE CHAIN ANALYSIS
FIGURE 010. PESTLE ANALYSIS
FIGURE 011. POWER PLANT SERVICES MARKET OVERVIEW BY TYPE
FIGURE 012. MAINTENANCE MARKET OVERVIEW (2016-2028)
FIGURE 013. REPAIR & OPERATIONS {MRO} MARKET OVERVIEW (2016-2028)
FIGURE 014. TESTING MARKET OVERVIEW (2016-2028)
FIGURE 015. OTHERS MARKET OVERVIEW (2016-2028)
FIGURE 016. POWER PLANT SERVICES MARKET OVERVIEW BY APPLICATION
FIGURE 017. STATE-OWNED ENTERPRISES MARKET OVERVIEW (2016-2028)
FIGURE 018. PRIVATE ENTERPRISES MARKET OVERVIEW (2016-2028)
FIGURE 019. NORTH AMERICA POWER PLANT SERVICES MARKET OVERVIEW BY COUNTRY (2016-2028)
FIGURE 020. EUROPE POWER PLANT SERVICES MARKET OVERVIEW BY COUNTRY (2016-2028)
FIGURE 021. ASIA PACIFIC POWER PLANT SERVICES MARKET OVERVIEW BY COUNTRY (2016-2028)
FIGURE 022. MIDDLE EAST & AFRICA POWER PLANT SERVICES MARKET OVERVIEW BY COUNTRY (2016-2028)
FIGURE 023. SOUTH AMERICA POWER PLANT SERVICES MARKET OVERVIEW BY COUNTRY (2016-2028)
Frequently Asked Questions :
The forecast period in the Power Plant Services Market research report is 2022-2028.
Alstom, GE, Mitsubishi Heavy Industries, Siemens, TNB Remaco, Toshiba, and Other Major Players.
The Power Plant Services Market is segmented into Service Type, Application, and Region. By Service Type, the market is categorized into Maintenance, Repair and Operations {MRO}, Testing, and Others. By Application, the market is categorized into State-Owned Enterprises, and Private Enterprises. By region, it is analyzed across North America (U.S.; Canada; Mexico), Europe (Germany; U.K.; France; Italy; Russia; Spain, etc.), Asia-Pacific (China; India; Japan; Southeast Asia, etc.), South America (Brazil; Argentina, etc.), Middle East & Africa (Saudi Arabia; South Africa, etc.).
Power plant services are the services provided by suppliers to power plants after in the post-commissioning environment. Power plant services help plant operators manage operational risks such as engineering, planning, and supply chain tasks. The services allow operators to concentrate more on their key business objectives.
The Global Power Plant Services market was estimated at USD 50.82 million in 2021, and is anticipated to reach USD 88.81 million by 2028, growing at a CAGR of 8.3%.


